
Home prices accelerate: Savanth Sebastian

GUEST OBSERVER
The CoreLogic Home Value Index of capital city home prices rose by 1.4 percent in March and was up 12.9 percent over the year.
Prices rose in all eight capital cities with Canberra and Darwin up the most (up 3.1 percent). Regional house prices by 0.8 percent in February (latest available).
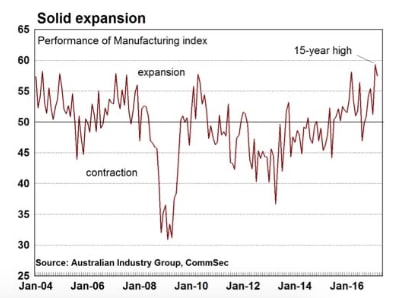
Manufacturing: The Performance of Manufacturing index eased from 15-year highs, down by 1.8 points to 57.5 in March. A reading above 50.0 indicates that the sector is expanding. This was the sixth consecutive month of expansion.
Home price data is important for retailers, especially those focussed on consumer durables. The manufacturing data provides guidance for companies in the Industrials sector.
What does it all mean?
The economic data has certainly started off the week on a healthy footing. Stronger home prices in March while manufacturing activity barely eased from 15 year highs.
It may be no surprise to see that home prices continue to lift across most capital cities. But what was clearly surprising was the magnitude of the lift in prices. Probably even more surprising was that home prices rose in all eight capital cities. Across the nation home prices rose by a substantial 1.4 per cent in March, matching a similar result in February and December 2016.
In fact over the four months to March home prices have accelerated by 4.9 percent – the strongest four-month period in 18 months.
Across the capital cities, it was encouraging that Darwin and Hobart featured heavily when it came to the strength in home prices as opposed to Sydney and Melbourne.
Interestingly the key resource states saw a rebound in home prices, although annual growth remained weak. The sustained lift in commodity prices may help to alleviate some of the weakness in home prices in coming months.
Overall policymakers will keep a close eye on the housing sector in the early part of 2017, and will prefer to see more balanced house price growth across the nation. In particular, a lift in regional house prices would be a positive outcome. Annual growth in home prices across regional centres was a healthier 4 per cent over the past 12 months.
Click to enlarge
What do the figures show?
Home prices
The CoreLogic Home Value Index of capital city home prices rose by 1.4 per cent in March and was up 12.9 per cent over the year.
In regional Australia, house prices rose by 0.8 per cent in February and were just 4 per cent higher than a year ago. (Regional prices cover just houses and data is up to the end of February).
In capital cities, house prices rose by 1.5 per cent in March while apartment prices rose by 0.9 per cent. House prices were up 13.4 per cent on a year ago and apartments were up by 9.8 per cent.
The average Australian capital city house price (median price based on settled sales over quarter) was $613,000 and the average unit price was $512,200.
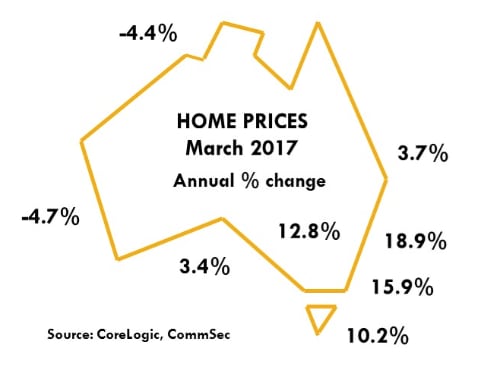
Dwelling prices rose in all eight capital cities in March: Hobart (up 3.1 per cent), Darwin (up 3.1 per cent), Melbourne (up 1.9 per cent), Canberra (up 1.4 per cent), Sydney (up 1.4 per cent), Perth (up 1 per cent), Adelaide (up 0.4 per cent) and Brisbane (up 0.2 per cent).
Home prices were higher than a year ago in six of the eight capital cities. Prices rose most in Sydney (up 18.9 per cent); followed by Melbourne (up 15.9 per cent), Canberra (up 12.8 per cent); Hobart (up 10.2 per cent); Adelaide (up 3.4 per cent); and Brisbane (up 3.7 per cent). Prices fell in Perth (down by 4.7 per cent) and Darwin (down 4.4 per cent)
Total returns on capital city dwellings rose by 16.7 per cent in the year to March with houses up 17.1 per cent on a year earlier and units up 14.3 per cent.
Performance of Manufacturing
The Performance of Manufacturing index fell from 15-year highs, down by 1.8 points to 57.5 in March. A reading above 50.0 indicates that the sector is expanding. This was the sixth consecutive month of expansion.
AIG notes “All seven activity sub-indexes in the Australian PMI® expanded in March (seasonally adjusted). Expansions in new orders (62.6 points) and sales (57.7 points) strengthened. Production expanded while slowing from more robust growth last month (57.6 points) as did employment (54.1 points). Deliveries (52.9 points) and exports (51.1 points) eased to more modest growth, while inventories turned up in March (55.5 points).”
“Comments from manufacturers in March indicate that demand continues to recover. Positive factors for demand include: higher prices for coal and other commodities; large infrastructure projects; the NBN rollout; stronger defence spending and stronger activity in the agricultural sector. Energy prices (particularly electricity) continue to play havoc with manufacturers. Concerns about energy pricing and security of supply are eroding profitability and confidence. Other input prices are increasing (including steel prices), which is putting manufacturers’ margins under further pressure. Export growth appear to be easing off for some manufacturers, compared to the strong surge of exports seen in 2016.”
What is the importance of the economic data?
The CoreLogic Hedonic Australian Home Value Index is based on Australia’s biggest property database. Unlike the ABS Index, which excludes terraces, semi-detached homes and apartments, the CoreLogic Hedonic Index includes all properties. Home prices are an important driver of wealth and spending.
The Australian Industry Group compiles the Performance of Manufacturing Index (PMI) each month. The Australian PMI is the Australian equivalent of the US ISM manufacturing gauge. The PMI is one of the timeliest economic indicators released in Australia. The PMI is useful not just in showing how the manufacturing sector is performing but in providing some sense about where it is heading. The key ‘forward looking’ components are orders and employment.
What are the implications for interest rates and investors?
Activity in the manufacturing sector is encouraging, especially the lift in new orders that has been identified in recent months. All the published data and anecdotes indicate that business conditions have markedly improved since the flat spot recorded for the economy in mid-2016.
Investors are once again driving key housing markets such as Sydney and Melbourne. But there are more risks, with investors relying on expected capital appreciation for returns on their investment rather than rising rents. More apartments are being built, supply will catch up to demand and growth of home prices will ease over the next few years. Investors need to be aware of the risks including recent actions by regulators to slow housing demand.
The broad-based health of Australian housing markets reduces the potential for further rate cuts. While fixed- term lending rates have lifted, it is still too early to canvas possible rate hikes from the Reserve Bank.
Savanth Sebastian is an economist for CommSec

