
Home prices and manufacturing activity accelerate: Savanth Sebastian

GUEST OBSERVER
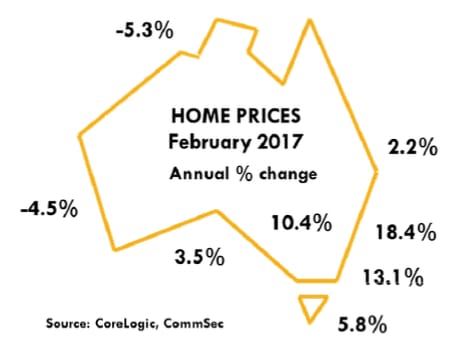
The CoreLogic Home Value Index of capital city home prices rose by 1.4 percent in February and was up 11.7 percent over the year.
Prices rose in five of the eight capital cities with Canberra up the most (up 3.2 per cent). Regional house prices rose by 0.6 per cent in January (latest available).
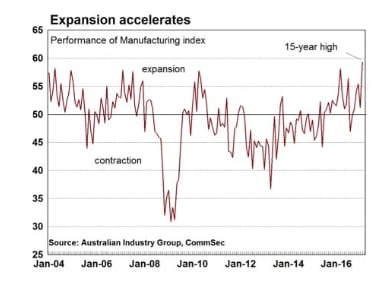
The Performance of Manufacturing index rose by 8.1 points to 59.3 in February – the strongest result since 2002. A reading above 50.0 indicates that the sector is expanding. This was the fifth consecutive month of expansion.
Home price data is important for retailers, especially those focussed on consumer durables. The manufacturing data provides guidance for companies in the Industrials sector.
What does it all mean?
It might just be one of the better days when it comes to economic data. Stronger home prices and the strongest expansion in manufacturing in 15 years. In addition the just-released economic growth data confirmed the momentum shift across the Australian economy.
It may be no surprise to see that home prices continue to lift across most capital cities. But what was clearly surprising was the size of the lift in prices. Across the nation home prices rose by a substantial 1.4 per cent in February, matching a similar result in December - the fastest monthly growth in 9 months. In fact over the three months to February home prices have accelerated by 3.5 per cent.
Across the capital cities, Sydney and Melbourne featured heavily but what was more encouraging was the strength in Canberra and Hobart home prices. Canberra prices rose by 3.2 per cent in February to be up 10.4 per cent over the year. Interestingly the key resource states continued to see significant weakness, with substantial falls in home prices across Darwin and Perth. The sustained lift in commodity prices may help to alleviate some of the weakness in coming months.
Overall policymakers will keep a close eye on the housing sector the early part of 2017, and will prefer to see more balanced house price growth across the nation. In particular, a lift in regional house prices would be a positive outcome. Annual growth in home prices across regional centres was just 1.1 per cent over the past 12 months.
What do the figures show?
Home prices
The CoreLogic Home Value Index of capital city home prices rose by 1.4 per cent in February and was up 11.7 per cent over the year.
In regional Australia, house prices rose by 0.6 per cent in January and were just 1.1 per cent higher than a year ago. (Regional prices cover just houses and data is up to the end of January).
In capital cities, house prices rose by 1.5 per cent in February while apartment prices rose by 1 per cent. House prices were up 12.0 per cent on a year ago and apartments were up by 9.2 per cent.
The average Australian capital city house price (median price based on settled sales over quarter) was $600,000 and the average unit price was $495,000.
Dwelling prices rose in five of the eight capital cities in February: Canberra (up 3.2 per cent), Sydney (up 2.6 per cent), Melbourne (up 1.5 per cent), Hobart (up 1 per cent), and Adelaide (up 0.6 per cent). Prices fell the most in Darwin (down 4.3 per cent), Perth (down 2.4 per cent), and Brisbane (down 0.4 per cent).
Home prices were higher than a year ago in six of the eight capital cities. Prices rose most in Sydney (up 18.4 per cent); followed by Melbourne (up 13.1 per cent), Canberra (up 10.4 per cent); Hobart (up 5.8 per cent); Adelaide (up 3.5 per cent); and Brisbane (up 2.2 per cent). Prices fell in Perth (down by 4.5 per cent) and Darwin (down 5.3 per cent)
Total returns on capital city dwellings rose by 15.4 per cent in the year to February with houses up 15.7 per cent on a year earlier and units up 13.8 per cent.
Performance of Manufacturing\
The Performance of Manufacturing index rose by 8.1 points to 59.3 in February – the strongest result since 2002. A reading above 50.0 indicates that the sector is expanding. This was the fifth consecutive month of expansion.
AIG notes “Six of the seven activity sub-indexes in the Australian PMI® expanded in February (seasonally adjusted). Encouragingly for the outlook, new orders (60.6 points) and sales (55.3 points) grew strongly. Production jumped from stable conditions in January to a strong expansion (65.3 points), as did employment (57.5 points). Deliveries lifted out of contraction (56.3 points) while exports strengthened further (57.0 points). Reflecting this surge in demand, inventories contracted mildly in the month (48.3 points.”
“Comments from manufacturers in February indicate that demand looks to be increasing and confidence returning to some of the larger sub-sectors such as food processing and machinery and equipment (other than auto). Exports are continuing to provide a good source of growth, as are large transport infrastructure projects and increased activity in parts of mining and agriculture in response to the recovery in prices for bulk commodities, wool and some grains. On the inputs side, energy costs and energy reliability are posing a significant threat to ongoing profitability and viability for some manufacturers.”
What is the importance of the economic data?
The CoreLogic Hedonic Australian Home Value Index is based on Australia’s biggest property database. Unlike the ABS Index, which excludes terraces, semi-detached homes and apartments, the CoreLogic Hedonic Index includes all properties. Home prices are an important driver of wealth and spending.
The Australian Industry Group compiles the Performance of Manufacturing Index (PMI) each month. The Australian PMI is the Australian equivalent of the US ISM manufacturing gauge. The PMI is one of the timeliest economic indicators released in Australia. The PMI is useful not just in showing how the manufacturing sector is performing but in providing some sense about where it is heading. The key ‘forward looking’ components are orders and employment.
What are the implications for interest rates and investors?
Activity in the manufacturing sector is encouraging especially the lift in new orders that has been identified in recent months. All the published data and anecdotes indicate that business conditions have markedly improved since the flat spot recorded for the economy in mid-2016.
Investors are once again driving key housing markets such as Sydney and Melbourne. But there are more risks, with investors relying on expected capital appreciation for returns on their investment rather than rising rents. More apartments are being built, supply will catch up to demand and growth of home prices will ease over the next few years. Investors need to be aware of the risks including further actions by regulators to slow housing demand.
The broad-based health of Australian housing markets reduces the potential for further rate cuts. While fixed-term lending rates have lifted, it is still too early to canvas possible rate hikes from the Reserve Bank.
Savanth Sebastian is an economist for CommSec
Jonathan Chancellor
Jonathan Chancellor is one of Australia's most respected property journalists, having been at the top of the game since the early 1980s. Jonathan co-founded the property industry website Property Observer and has written for national and international publications.

