

The potential implications of the US Presidential election on Australia: NAB's Alan Oster

GUEST OBSERVER
These forecasts contained within this document were finalised prior to the US election, and do not incorporate the impact on financial markets, the global economy or Australian economy from the result.
The impact of the win in the U.S. Presidential election by Mr Trump is at this stage highly uncertain. What Mr Trump’s priorities are how he will interact with the Congress , and other nations is all up in the air. Some key issues that we will be monitoring are:
The degree of volatility in markets. Financial markets experienced large moves as it became more apparent that Mr Trump would win but then reversed course. Persistent bouts of volatility would have implications for Federal Reserve monetary policy as they typically push back any planned rate hikes in that environment. Uncertainty can also affect business investment decisions and consumer confidence. At this stage we are leaving our call for a Fed rate hike in December unchanged.
The likelihood of greater fiscal stimulus (and public debt) as MrTrump’s plans includeds ignificant tax cuts and public spending proposals, with limited budgetary savings. How the Republican congress – which has in the past tried to curb the budget deficit – will react is unclear, although the proposed tax cuts would have strong appeal.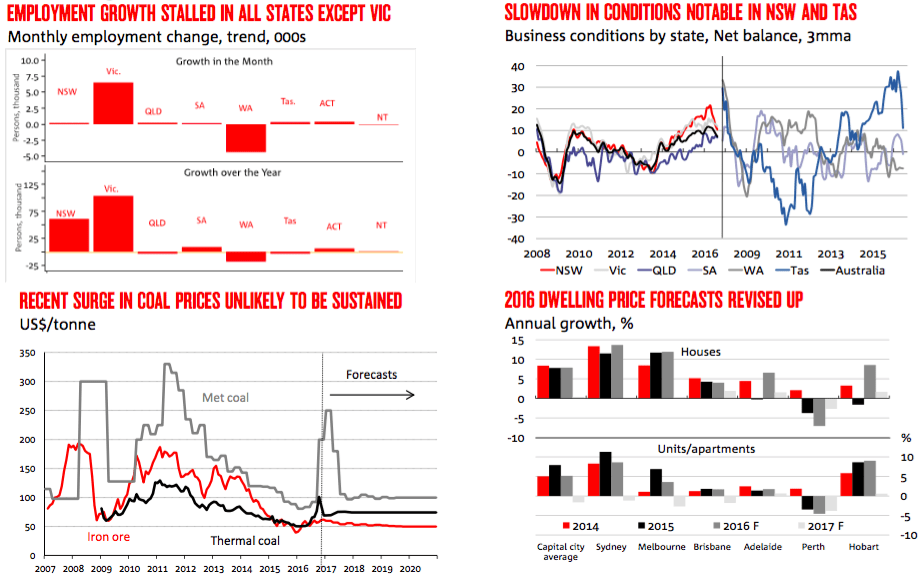
What measures are implemented to curb what the President-elect sees as “unfair” trade, particularly in relation to China and NAFTA. These could include declaring China to be a “currency manipulator” “on day one” and a 45% tariff on US imports of Chinese goods. The risk is that this could trigger a trade war.
How aggressive are the steps taken to reduce ‘illegal’ immigration (building a wall on the border with Mexico), and to deport existing unauthorised immigrants residing in the US.
Fiscal stimulus in an economy close to full employment is likely to be inflationary and suggests a risk that the US Federal Reserve may eventually have to increase rates more aggressively. This, coupled with higher public debt, could see long-term bond yields move higher.
For Australia specifically, perhaps the biggest threat to the Australian economy in the wake of the election is the implication for trade policy. In particular, Mr Trump’s criticisms of China and his warning that a 45 percent tariff could be imposed on imports of Chinese goods raises the risk of a US-China trade war if the latter retaliated.
China is easily Australia’s biggest export market but the US is the biggest foreign investor here and the third biggest export market. Australia would face an unenviable position if trade tensions arose between such important economic partners as China and the US. Additionally, the future of broader trade pacts, including the TPP, are now under threat.
On alert
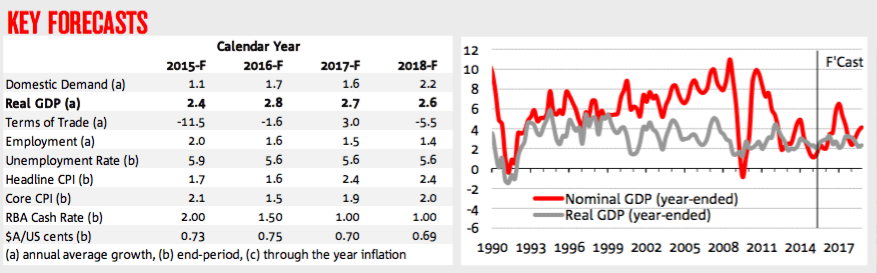
Our real GDP forecasts have been revised slightly, mainly due to lower starting point for Q3 2016 with partial data suggesting a large subtraction from net exports. We now expect real GDP growth of 2.8 percent in 2016, 2.7 percent in 2017 and 2.6 percent in 2018. The unemployment rate is expected to hover between 5.5 percent and 5 3⁄4 percent through the forecast horizon. These forecasts are somewhat more cautious than the RBA, especially in 2018.We are monitoring the loss of momentum in some key high frequency indicators, including the pullback in business conditions, capacity utilisation and employment growth. In particular we note the softening of these in NSW and services, areas which hitherto have been key sources of strength. At this stage, the deterioration is not yet enough to warrant a significant change in the outlook, but a continuation of these downward trends could signal an earlier turn in the non-mining economy than expected.

These forecasts were finalised prior to the US election, and do not incorporate the impact on financial markets, the global economy or Australian economy from the result.
Our Spotlight article this month explores the surge in LNG exports underway, and our expectation for prices.

The key trends and themes underpinning our Australian economic forecasts are unchanged. These were finalised prior to the US election, and hence do not incorporate the impact on financial markets, the global and Australian economies from the result. For some colour, see our recent note outlining the possible effects on trade, taxation, monetary policy and financial markets.
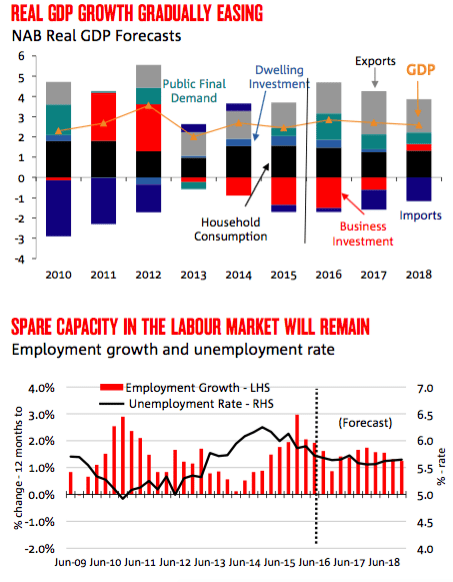
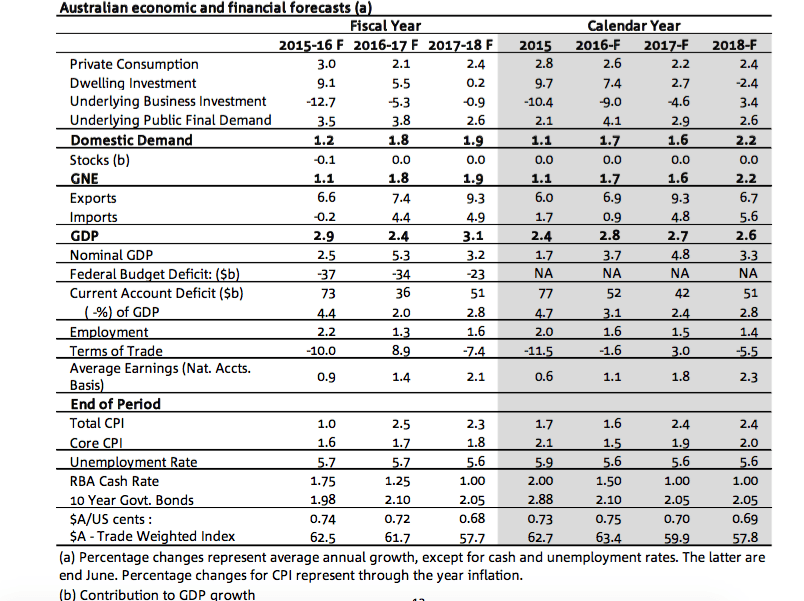
Our real GDP forecasts are slightly lower in 2016 and 2017 due to a lower starting point for Q3 2016, with partial data indicating a subtraction from net exports of 0.3 ppts. We expect real GDP growth to slow from 2.8% in 2016 to 2.7% in 2017 and 2.6% in 2018. The key tenets of our forecasts include:
- a modest outlook for household consumption growth, owing to only a very subdued pick up in wages and household income growth;
- the drag from mining investment reducing from here, with the adjustment approximately 70 percent of the way through;
- moderate growth forecast for non-mining business investment;
- dwelling construction adding to growth through 2017 but marginally detracting from growth in 2018 as the construction cycle turns;
- net exports adding significantly to growth through the forecast horizon, largely due to surging LNG exports and strong net services trade;
- moderate employment growth sufficient to keep the unemployment rate stable in a range between 51⁄2 and 5 3⁄4 percent
- there will be a temporary boost to the terms of trade, export earnings, profits and nominal GDP, before coking coal prices reverse.
We are monitoring the recent slowdown in employment, business conditions and capacity utilisation closely, in particular the easing evident in NSW and services sectors. For now, we see this as a temporary loss of momentum, but there are clearly downside risks if the downward trend is sustained.
Our forecasts are more cautious than the RBA who assume a stronger recovery through the non-mining economy, especially in 2018, with the central bank’s forecasts for household consumption in particular more optimistic. The RBA’s terms of trade forecasts are also higher, especially for coking coal.
Our current forecasts are predicated on the expectation that global growth will pick up very gradually from 2.9% in 2016 to 3.2% in 2017 and 2018. They also assume the AUD will remain high through the remainder of 2016 before easing through 2017 as the US resumes its rate hike path.
These are expectations which will be revisited as we digest the result of the US election.

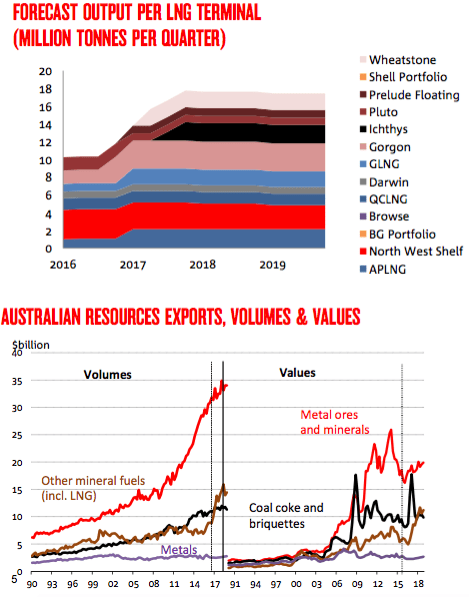
Western Australia is Australia’s biggest gas producer, with most of the state’s production (which is isolated from the east) destined for LNG export. Queensland production has increased rapidly with the development coal seam gas (CSG) projects to feed three LNG terminals on Curtis Island.
Australia exported 27.6 million tonnes of LNG in 2015. We forecast that exports will total 40.8 million tonnes in 2016, 64.0 million tonnes in 2017 and 70.6 million tonnes in 2018.

LNG exports will contribute significantly to real GDP growth going forward, alone contributing 0.6, 1.0 and 0.3 ppts to annual GDP growth in 2016, 2017 and 2018 respectively, before flattening off at a high level.
East Asian LNG prices have fallen significantly since mid-2014 on the back of lower oil prices, to which many LNG contracts are tied. For example, most Japanese LNG contracts are based on the Japan Crude Cocktail (JCC) – the import price of crude oil into Japan.
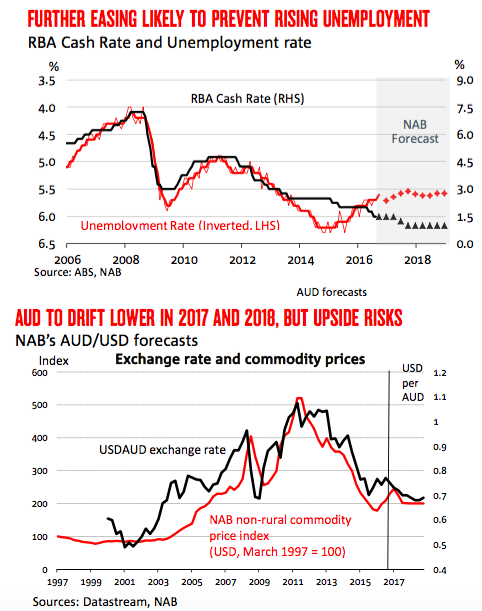
We expect crude oil prices to remain low in USD terms for at least the next two years. A subdued AUD will provide some limited support to local prices. We forecast the AUD will reach 0.70 USD by the end of 2017.
We expect the NAB LNG export price indicator recover gradually, in line with our forecasts for a slow recovery in oil prices. We place the Australian LNG export prices at AUD6.65/GJ (USD4.88/GJ) by the end of 2016, recovering to AUD8.16/GJ by the end of 2018. In export value terms, the price collapse will offset of the increased supply. We see the value of Australian LNG exports at just over AUD15.7 billion in 2016, a slight decrease on 2015. However, the value of exports should climb steadily in 2017.
Although residential gas prices have increased across Australia over the past 15 years following a period of relative stability in the 1990s, they remained underpinned by low wholesale prices struck through stable long term contracts. These contacts are confidential and public price data is not available, however it is generally considered in the industry that eastern Australian wholesale gas was contracted at around AUD2-4/GJ.
Although LNG export prices are hovering in the AUD6-8/GJ range at present (including the costs of liquefaction etc.), reports suggest that gas suppliers are offering long term wholesale contracts at up to AUD10/GJ on the expectation of a recovery in LNG export prices in the coming years. Spot prices on AEMO’s Short Term Trading Market have also reached and even exceeded export prices this year, although higher than expected gas demand from a cold winter and elevated demand for gas fired generation in South Australia (reflecting a number of factors).
Should spot and contract prices move consistently into the AUD 8-10/GJ range in the coming years, there will be significant consequences for households, businesses and electricity generators
Looking through some short-term volatility, recent partial indicators of consumer spending continue to paint a picture of lacklustre consumer spending activity, partly reflecting the ongoing slowing in employment growth and persistently soft wages growth. The latest ABS retail trade data showed that retail volume for the September quarter has contracted by 0.1% relative to the June quarter, but better-than-expected monthly growth for nominal retail turnover in September hints at a possible growth pick-up for Q4.
NAB’s monthly Online Retail Sales Index for September suggests that trend growth for online spending has eased further, although online spending in seasonally adjusted terms accelerated in the month. The latter was largely driven by a strong pick-up in growth of takeaway food, which in turn reflects the burgeoning uptake of mobile food ordering applications. In trend terms, retail conditions according to the NAB business survey eased to -3 index points in September, the lowest level since late 2014.
That said, overall consumption growth in coming quarters is expected to be partly supported by a sustained low interest environment and positive wealth impetus from higher dwelling house prices in major capital cities. We are currently forecasting real household consumption to rise by 2.6% in 2016, before moderating to 2.2% in 2017 and 2.4% in 2018.
Underlying inflation in the September quarter was a lower than average 1.5% y/y, and has been for the past three quarters. Subdued wages growth and low rent inflation have contributed to non-tradables inflation remaining low at 1.7% y/y. A protracted period of low rent inflation is expected given the current high levels of dwelling construction. Inflation in new dwelling construction has been weak too but could pick up given the elevated activity in the dwelling construction industry.
Spare capacity in the labour market will continue to restrain wages growth. Tradables inflation was 0.7% y/y in the September quarter but excluding volatile items and tobacco was zero. Heightened retail competition is keeping exchange rate pass through limited. The October NAB Business Survey showed a significant improvement in retail business conditions which is encouraging. Overall, we forecast inflation to remain depressed at below or just on 2% in 2017 and 2018, with headline inflation being a little higher due to tobacco excise increases and higher fuel prices.
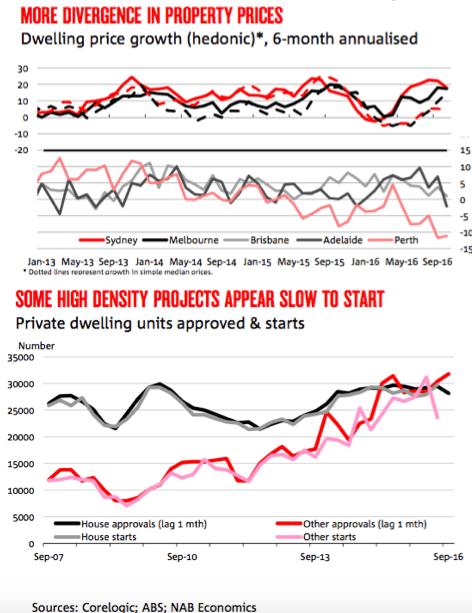
Demand appears to be solid, with investor finance showing signs of trending up again, although approvals for owner-occupiers have eased in recent months (albeit still at high levels) and foreign demand may have dropped back. The NAB Residential Property Survey, suggested an upbeat market in Q3 2016, particularly in NSW and Victoria where sentiment jumped sharply in the quarter – coinciding with upward revisions to price expectations within the Survey. However, it also indicated that foreign buyers played a lesser role in the local market. Relatively tight supply conditions are contributing to the market trends in Sydney and Melbourne. Transaction volumes remain well down on the levels of a year ago, auction clearance rates are still elevated, and vacancy rates tend to suggest an adequate-to-under supplied market.
Building approvals slowed sharply in September, but remain quite elevated – holding up especially well in NSW. While the trend suggest a possible peak in the cycle, the still elevated level of approvals and projects in the pipeline suggests ongoing support for dwelling investment – expected to rise 7.4% in 2016 and 2.3% in 2017, before become a (small) drag on economic activity further out. However, it is not clear if the recent divergence between approvals and building starts (mainly for medium-density projects) indicates inherent issues (demand, financing, or otherwise) getting these projects off the ground. If so, it could suggest both a smaller than expected peak in the construction cycle, but also a smaller than anticipated contraction further out.
In September, employment in seasonally adjusted terms fell further by 9.8k, but another notable fall of 0.2ppt in the participation rate to 64.5% saw the official unemployment rate ease by 0.1% to 5.6%. While the veracity of the ABS data for the month has been called into question due to some unusual movements stemming from Queensland, the overall easing pace in trend employment growth, characterised by consecutive falls in full-time jobs, appears nevertheless symptomatic of some re- weakening of the labour market.
Employment growth in most states and territories continue to trend downwards, with the easing in NSW particularly notable. Victoria was an exception, having recovered slightly in recent months, while the ACT continues to show a distinct rising trajectory. SA also appears to be showing some tentative recovery more recently. Meanwhile, employment growth in Tasmania and Western Australia remains negative, while NT is close to neutral. Despite a relatively low headline unemployment rate, the underemployment and underutilisation rates remain elevated, with the recent strength in part-time employment more likely to reflect the weakness in labour demand instead of a sudden change in workers’ preferences.
The NAB Monthly Business Survey was a little less encouraging in October. Business conditions remain at above-average levels, but have steadily eased from their recent peak. At the same time, despite showing relatively good resilience to external shocks, business confidence has fallen to below long- run average levels.
The moderation in Survey indicators is a concerning trend that warrants monitoring, but our assessment is that the deterioration to date is not (yet) enough to warrant a significant change in the outlook. However, if these trends were to continue, it would be unsettling and imply that the non- mining recovery has started to run out of steam earlier than expected. Indicators from the Survey that relate to the business investment outlook were somewhat mixed in October. NAB’s measure of capacity utilisation eased a little further this month, continuing its recent downward trend. Utilisation rates fell to 80.5% (from 80.6%), which is below the long-run average of 81%.
The fall is consistent with softer trading conditions, and can help to explain the partial pull-back in the Survey’s capex measure (suggesting additions to capacity are less necessary). Despite some signs of deterioration in the Survey, firms suggested that their demand for credit had increased compared to three months prior, while they also indicated some improvement in the availability of credit. Meanwhile, data from the RBA suggests business credit continued to grow, albeit at fairly subdued levels.
Non-residential building approvals continue to be volatile, more than doubling in September, driven by a spike in tourism-related approvals (mainly in NSW and Victoria), although approvals for other personal services also increased. Commercial office approvals also increased sharply, consistent with falling vacancy rates and improving growth in office capital values in Sydney and Melbourne. It is not yet clear whether the spike merely reflects ongoing volatility, or a more sustained lift in non-residential construction. Indeed, NAB’s Commercial Property Survey showed an improvement in commercial property market sentiment in Q3, although the development intentions of respondents was fairly mixed, with most of the positive outcomes seemingly restricted to the residential segments.
In terms of the longer term outlook, weakness was still very apparent in the ABS’s Q2 Private New Capital Expenditure (Capex) Survey, but the expectation for spending in 2016-17 did improve from previous estimates – even with further large declines expected in mining.
Business investment (around 12% of GDP) is forecast to decline by around 9.0% in 2016 and 4.6% 2017. In 2018, business investment will increase moderately (+3.4%).
In September, employment in seasonally adjusted terms fell further by 9.8k, but another notable fall of 0.2ppt in the participation rate to 64.5% saw the official unemployment rate ease by 0.1% to 5.6%. While the veracity of the ABS data for the month has been called into question due to some unusual movements stemming from Queensland, the overall easing pace in trend employment growth, characterised by consecutive falls in full-time jobs, appears nevertheless symptomatic of some re- weakening of the labour market.
Employment growth in most states and territories continue to trend downwards, with the easing in NSW particularly notable. Victoria was an exception, having recovered slightly in recent months, while the ACT continues to show a distinct rising trajectory. SA also appears to be showing some tentative recovery more recently. Meanwhile, employment growth in Tasmania and Western Australia remains negative, while NT is close to neutral. Despite a relatively low headline unemployment rate, the underemployment and underutilisation rates remain elevated, with the recent strength in part-time employment more likely to reflect the weakness in labour demand instead of a sudden change in workers’ preferences.
The employment index from the NAB monthly business survey eased in October to the neutral mark (from +1 in the previous month), to be below the long-term average of +1. This outcome hints at an annual job creation rate of around 181k (around 15k per month) in coming months, which is barely sufficient to steady the unemployment rate. As such, we expect the unemployment rate to remain relatively steady in coming quarters, to be at 5.6% by end-16 and stabilising at around that level afterwards.
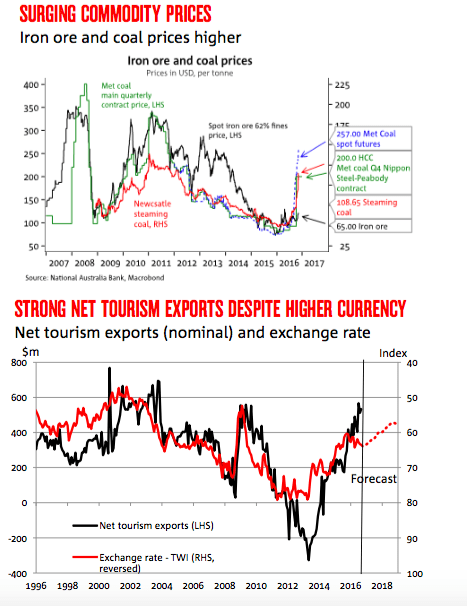
Despite sharply higher commodity prices, export volumes were steady in Q3 and were offset by higher growth in imports, which will likely result in net exports detracting an estimated 0.3 ppts from GDP growth in Q3. Higher commodity prices did see the terms of trade rise by around 4.3% over the quarter, which helped narrow the trade deficit.
The step up in the hard coking coal contract price for Q4 from $US92.5 to $US200/t and a further 30% uplift in spot prices to over $300/t could see export receipts even further. There has also been a rise in thermal coal prices. As a result of the high prices, some idle production capacity could be lured back into seaborne coal markets. This includes some mines in Queensland that were closed due to low prices. These prices are unsustainable in our view, however the timing and the rate of the eventual decline is uncertain. Chinese authorities introduced coal production restrictions to attempt to boost profitability for domestic producers, however there have been subsequent comments expressing concerns about the flow on impacts to steel mills and electricity generators. The National Development and Reform Commission has proposed relaxation of the conditions to boost supply. On the demand side, slowing residential construction in China is set to impact steel demand, impacting the demand for metallurgical coal. Combined, these factors should bring the market back towards balance, and bring prices back towards ‘normal’ levels. The potential for a rapid supply response – particularly domestic production in China – drives the quick fall in our price profile.
Iron ore export volumes rose by a smaller 2% during Q3, after a strong rise in the June quarter. Exports are expected to continue to expand, with the Roy Hill mines slowly ramping up capacity, but at a slower pace.
The agricultural production outlook is reliant on the climate outlook. Spring rainfall has been above average across eastern Australia and more rain could hamper crop yield and quality, although conditions have been drier very recently. Agricultural prices are mixed, with dairy prices continuing to rebound and wheat gaining slowly, although cattle prices have fallenImport volumes expanded an estimated 2% in Q3. Moderate growth in consumption and non-mining investment, and the re-appreciation of the AUD will likely see imports grow, despite the drag on capital goods imports from unwinding mining investment. Net tourism and education exports are also expected to rise despite the higher AUD.

