
Australian house market grew 1.63 percent in September quarter: Eliza Owen

GUEST OBSERVER
Residex has issued its latest non-revised growth in median values chart.
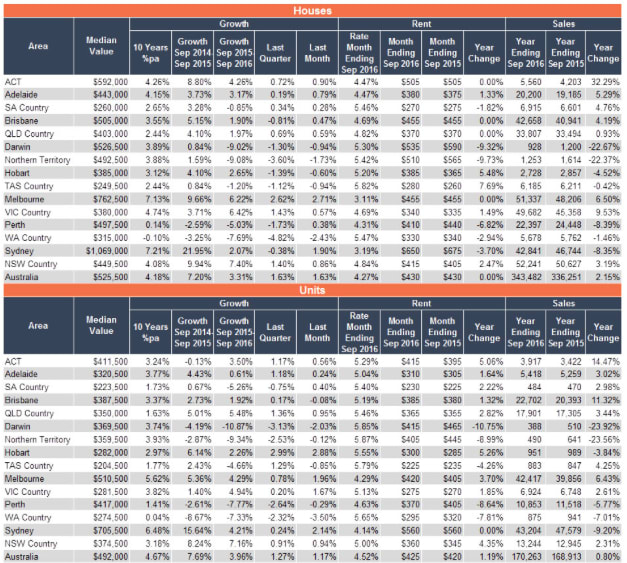
These figures suggest the Australian house market grew 1.63 percent in the September quarter.
Growth was driven almost entirely by a strong surge of 1.63 percent in the month of September, off the back of a slight decline in August. Annual performance of Australian houses was 3.31 percent, as opposed to 7.2 percent in the previous year.
Similarly, the median non-revised unit value across Australia experienced 1.27 percent growth in the September quarter, with 1.17 percent growth in the month of September alone.
Unit values across Australia increased 3.96 percent.
Table 1: September 2016 Median Value Index
Source: Residex
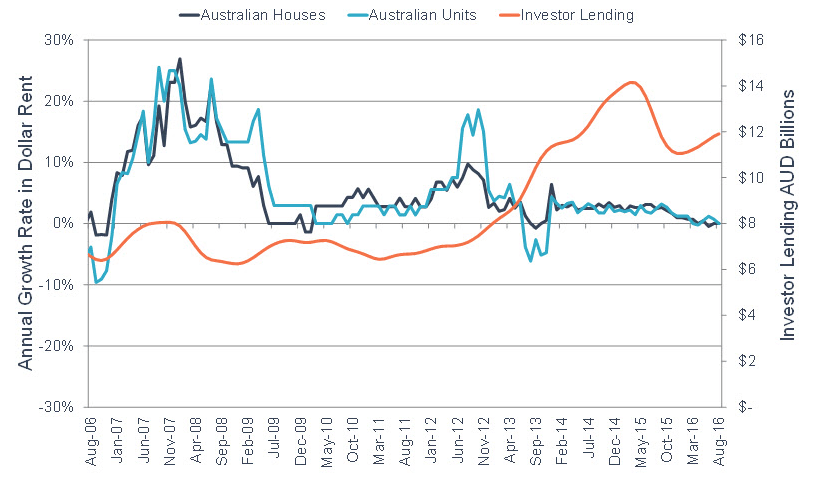
While the monthly figures are relatively volatile, annual growth shows a more distinct trend. Graph 1 plots historical annual growth rates for the median Australian house and unit values.
Graph 1: Residex Non-Revised Median Values – Historical Growth of Australian Houses and Units

Source: Residex
Graph 1 suggests that the aggregated housing market peaked in 2014, though it has since had a very slow decline relative to past growth cycles. Growth in dwelling markets is likely to have been sustained by the four cash rate cuts that have taken place since the peak of the most recent cycle.
Country NSW houses had the highest value growth in the year to September at 7.41% in capital gains. This figure was down on the previous year’s growth of 9.94%, suggesting that regional NSW is now following the downswing in the Sydney market.
Spillover into the regional NSW market was expected as those who were priced out of Sydney during the recent housing boom (in which the median Sydney dwelling grew 33% between 2013 and 2016) sought more affordable properties in which to live or invest.
Regional areas of NSW also currently provide higher rental yields for investors. Residex median rent estimates remained virtually unchanged in Australian houses and units. The strongest surge in rents was in ACT units and Hobart and Tasmanian houses, while resource market rents continued to decline. The overall subdued growth in rents is likely due to an increase in investor activity, which has potentially increased the stock of rental properties.
Graph 2 displays the annual change in dollar values of rents for the past 10 years, alongside ABS dollar values of loans taken out by investors at each month. From 2013, the uptick in investor lending seemed to have a more dramatic impact on units. The second surge from late 2015 is also likely to dampen rent growth in units.
Graph 2: Annual Change in Residex median rent vs ABS Dollar Value of Investor Loans
Source: Residex
Given that most Australian markets follow the Sydney growth cycle at a lag, it is tempting to aggregate our markets and say that Australia as a whole is well into the downswing phase of the growth cycle, and some moderate adjustments may be expected over the course of 2017.
However, Australia’s smaller, resource based markets were thrown into a correction following resource price shocks. They cannot be amassed with the rest of Australia’s housing market movements, and it is increasingly difficult to place them in traditional economic cycles.
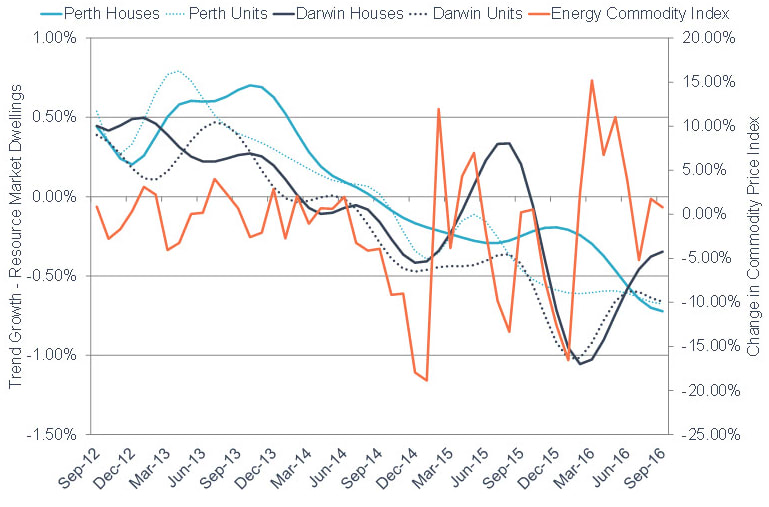
The energy commodity price index surmises dramatic movements in what makes up approximately 30% of Australian exports: a 70% decline between June 2014 and January 2016, followed by a 41% recovery between the beginning of 2016 and September.
Graph 3 plots the monthly commodity price index changes against monthly trend capital growth in Perth and Darwin non-revised median values. The commodity price index seems to have a lead lag effect on growth, particularly in Darwin where the dwelling market is small, reducing the severity of declines.
Graph 3: Commodity Price Index versus Monthly Trend Growth in Perth and Darwin
Source: Residex
Unfortunately, these commodity price increases are not representative of a cyclical recovery in resources, but was more likely the result of severe weather conditions in China which temporarily limited the supply of coal and steel, structural limits to coal supply in Australia, and OPEC negotiations which saw a spike in the price of oil. While this may temporarily restore confidence in resource dwelling markets, Perth and Darwin are still in a correction period.
With 1.3 percent inflation at the September quarter up slightly from the 1% in the previous quarter, the RBA may have room to leave rates on hold. A steady cash rate in the current climate is likely to see a steady fall in growth rates across Australian dwelling markets, with small, niche markets such as Hobart offering promising fundamentals for nearer term growth.
Eliza Owen is the market analyst for Onthehouse.com.au. She can be contacted here.