
Happy 25th birthday Australian economy: CommSec's Craig James

GUEST OBSERVER
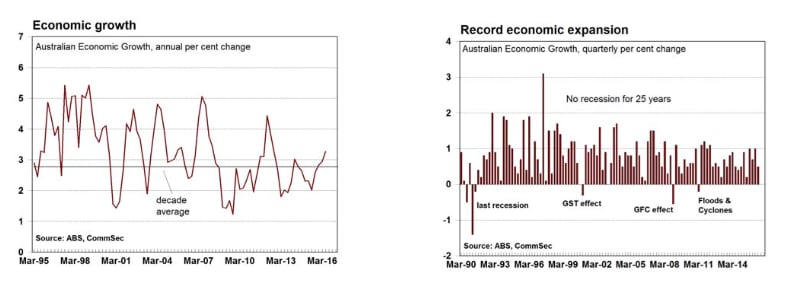
The Australian economy has just completed 25 consecutive years of economic growth. The last recession ended in June 1991.
Solid growth: The economy grew by 0.5 percent in the June quarter with annual growth lifting from 3.0 percent to 3.3 percent.
Contribution to growth: The biggest contributions to growth came from public investment (+0.7 percentage points) (pp), government consumption and inventories (both +0.3pp), household spending (+0.2pp), dwelling investment and private equipment investment (both +0.1pp). The biggest drag on growth was from non-residential building (-0.8 percentage points) and net exports (-0.2pp).
Income: Real gross national income rose by 0.6 percent in the June quarter to be up 2.5 percent on the year. In nominal terms GDP lifted 1.3 percent in the quarter and rose by 3.4 percent over the year.
Productivity: Gross value added per hours worked in the market sector rose by 1.5 percent in the June quarter and by 2.9 percent over the year.
Industry sectors: Fourteen of the 19 industry sectors expanded in the June quarter. The strongest sector was Professional, scientific and technical services, up 3.2 percent and adding 0.2 percentage points (pp) to growth. Eight other sectors added 0.1pp to overall growth. The Mining sector fell by 3.5 percent in the quarter and cutting 0.3pp from overall growth.
What does it all mean?
There are no signs that Australia’s record economic expansion is coming to an end. Far from it – annual growth has lifted to 4-year highs. Australia has now notched up 100 quarters without a recession. Netherlands holds the record for the longest expansion at 103 quarters. Over the next year Australia should pick up the gold medal for the longest economic expansion of a developed economy in the modern era.
It’s worth reflecting on Australia’s economic position. Economic growth is the fastest in four years and above long- term averages. Inflation stands at 1.0 percent. Interest rates stand at 1.5 percent. Unemployment stands at 5.7 percent. The mining construction boom may be over, but it has been replaced by a housing construction boom. There is much to like and celebrate about Australia’s economy.
Could we be doing even better? There is always room for improvement. For instance, we could have even lower unemployment but still keeping inflationary pressures contained. The challenge for the authorities is to keep the expansion intact.
The Reserve Bank could still cut rates – that is, if inflation remains low, rates could be cut to allow the economy to grow even faster. We continue to pencil in a rate cut in November. The question though is whether rates are already low enough to boost growth. What do the figures show? National Accounts:
Economic Growth: The Australian economy grew by 0.5 percent in the June quarter after a downwardly-revised 1.0 percent increase in the March quarter (previously up 1.1 percent). Forecasts had centred on 0.5 percent growth in the economy in the quarter. The economy still hasn’t experienced a recession for 25 years.
The economy has grown 3.3 percent over the past year, above the decade-average growth rate of 2.8 percent and above the 15-year average of 3.0 percent. Annualised growth over the past six months has been 3.2 percent.
The non-farm economy grew by 0.6 percent in the June quarter after a rising by 1.0 percent in the March quarter. Annual growth stands at 3.4 percent.
Farm GDP fell by 4.3 percent in the June quarter after expanding by 3.4 percent in the March quarter. Farm GDP fell 3.3 percent over the year.
At current prices, GDP rose by 1.3 percent in the June quarter to be up 3.4 percent on the year. The annual growth rate is still well below the decade average of 6.2 percent. Over the year to June 2016, the Australian economy was valued at $1,650 billion.
Growth drivers: The biggest contributions to growth came from public investment (+0.7 percentage points), government consumption and inventories (both +0.3pp), household spending (+0.2pp) and dwelling investment and private equipment investment (both +0.1pp). The biggest drag on growth was from non-residential building (- 0.8 percentage points) and net exports (-0.2pp).
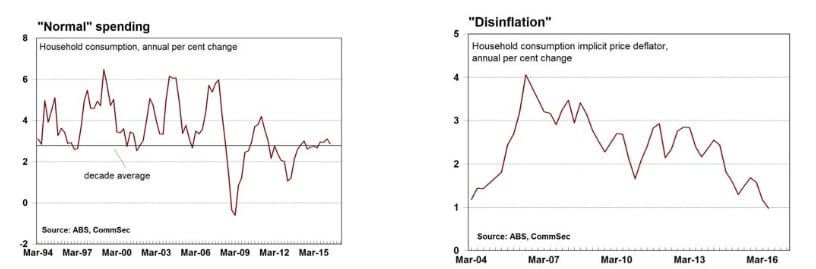
Inflation: In terms of domestic price pressures, the household consumption implicit price deflator rose by 0.4 percent in the June quarter after a 0.1 percent fall in the March quarter. Annual growth stands at just 0.9 percent – the lowest rate in 17 years. Real non-farm unit labour costs fell by 0.8 percent in the June quarter after a flat result in the March quarter. Real non-farm unit labour costs fell by 0.6 percent over the year.
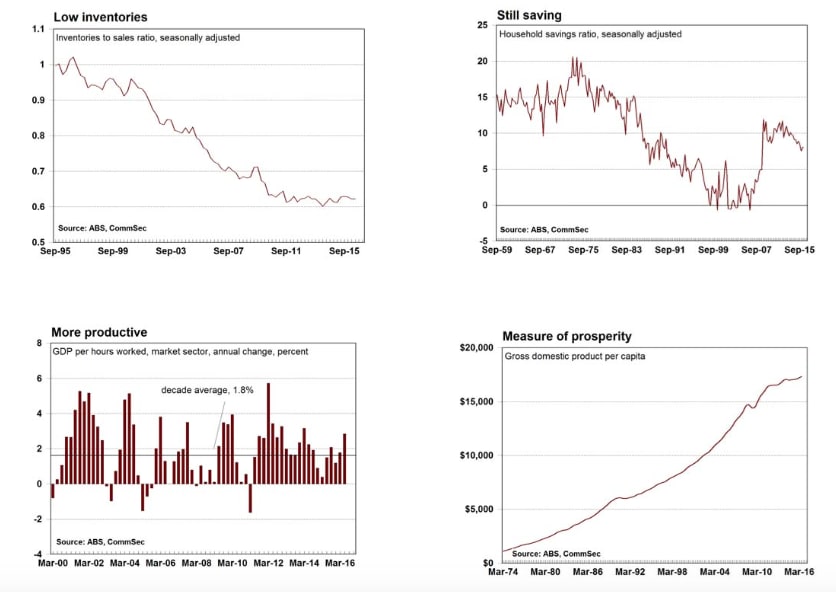
Productivity: Gross value added per hour worked market sector rose by 1.5 percent in the quarter and by 2.9 percent on the year. GDP per hour worked rose by 1.2 percent in the quarter and by 2.7 percent over the year. And hours worked in the market sector fell by 1.1 percent in the quarter to be up 0.1 percent on the year.
States & Territories: The only data available is state final demand (more accurate data would include net exports but it is not available for all states and territories). The ACT had the fastest annual growth rate in the June quarter (up 6.0 percent), followed by NSW (up 3.8 percent), Victoria (up 3.5 percent), Tasmania (up 1.9 percent), South Australia (up 1.7 percent) and Queensland (up 0.4 percent). The Northern Territory contracted by 10.4 percent, followed by Western Australia (down 7.3 percent).
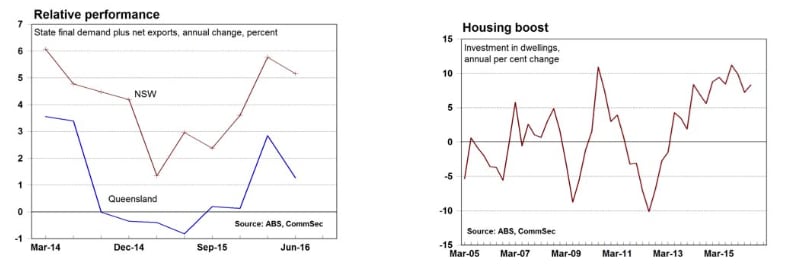
Only five State and Territory economies had data on exports and imports. If you add in the trade figures, the ACT economy was up 6.3 percent over the year with NSW up 5.2 percent, Victoria up 4.5 percent, South Australia up 3.0 percent and Queensland up 1.3 percent.
Consumer spending lifts. Household spending rose by 0.4 percent in the June quarter to be up 2.9 percent for the year. Only six of the 17 sectors recorded weaker spending in the quarter. Spending fell most in in Cigarettes & tobacco (down 2.3 percent) and Electricity, gas and other fuel (down 2.2 percent). Spending rose most in Purchase of vehicles (up by 2.8 percent) and Health (up 2.1 percent).
Industry sectors: Fourteen of the 19 industry sectors expanded in the June quarter. The strongest sector was Professional, scientific and technical services, up 3.2 percent and adding 0.2 percentage points (pp) to growth. Eight other sectors added 0.1pp to growth. The Mining sector fell by 3.5 percent in the quarter cutting 0.3pp from overall growth.
Other points:
Profit share rises. In seasonally adjusted terms, the ratio of profits to total factor income rose from 24.5 percent to 24.9 percent in the June quarter. The wages share was steady at 54.1 percent.
Household savings ratio steady. The household saving ratio was steady at 8.0 percent in seasonally adjusted terms in the June quarter. In trend terms household saving was steady at 7.9 percent in the June quarter.
Imports rose as a share of spending. The imports to sales ratio rose from 0.373 in the March quarter to 0.377 in the June quarter.
The inventory to sales ratio was steady at 0.622 in the June quarter. What is the importance of the economic data?
The quarterly National Income, Expenditure and Product release (national accounts) from the Bureau of Statistics is the most complete assessment of Australia’s economic performance. Detailed estimates are provided on incomes (wages, profits), spending (such as household, dwelling investment and trade (exports and imports) and production (comparing industry performance). Other data includes household saving and the economic performance of States and Territories.
The main use of the national accounts figures is as a historical record of economic performance. The information has little forward-looking value for currency, interest rate or share markets. What are the implications for interest rates and investors?
The national accounts data is backward looking. But the data is taken into account by the Reserve Bank, serving as a base for forecasts. The Reserve Bank uses six-month annualised growth figures to ascertain how the economy is travelling. And in that context growth annualises at around 3.2 per cent. The Reserve Bank had assumed growth of 3.25 percent in the June quarter.
Labour costs are falling, meaning that there probably hasn’t been a better time to be taking on staff. Inflation remains low but real wage gains are still occurring – wages are growing faster than prices. So there is also good news for consumers.
Productivity calculations are more problematic. Hours worked in the market sector fell. But gross value added per hour worked market sector rose 1.5 per cent in the June quarter to be up a healthy 2.9 per cent over the year. Ideally you would like to see more employment and hours worked as well as higher output. As always, there is scope for improvement.
GDP per capita continues to edge higher in real terms, indicating that our standard of living continues to rise. Perhaps growth is slower than in the past, but it is still rising.
Should the Reserve Bank cut rates again?
There is nothing in the data to prevent the Reserve Bank cutting rates again. The debate to be had though is whether rate cuts at historically-low levels are actually still stimulative. The only real sign of inflation is the “ownership transfer costs” or costs associated with buying or selling a home – up 9.5 per cent over the year.
Craig James is the chief economist at CommSec.

