
Property 101: Victorian residential property valuations issued
GUEST OBSERVER
The median price of houses in Victoria increased by 4 percent from $500,000 in the September 2015 quarter to $520,000 in the December 2015 quarter, having increased by 2.9 percent in the previous quarter (September 2015).
For the 12 months from December 2014 to December 2015, the median house price in Victoria increased 5.5 percent, from $493,000.
The median price of units in Victoria increased by 1.1 percent from $460,000 in the September 2015 quarter to $465,000 at the end of the December 2015 quarter, having recorded no change in the previous quarter.
The median price of units in Victoria for the December 2015 was lower than the median price of houses. For the 12 months from December 2014 to December 2015, median unit prices increased 2 percent from $456,000.
The median price of vacant land across Victoria remained at $185,000 from the September 2015 quarter to the end of the December 2015 quarter, having decreased in the previous quarter by 5.6 percent.
For the 12 months from December 2014 to December 2015, vacant land prices decreased by 2.6 percent, from $190,000 to $185,000.
Metropolitan Melbourne sales statistics for the December 2015 quarter show an increase of 3.3 percent to $630,000 for median house prices, a decrease of 0.4 percent to $490,000 for median unit prices and an increase of 7.7 percent to $237,000 for vacant land.
For the 12 months to December 2015, median sales prices in metropolitan Melbourne showed increases of 7.5 percent for houses, 2.1 percent for units and 12.9 percent for vacant land.
In the December 2015 quarter the median house price in country Victoria increased by 3.6 percent to $316,000. Units decreased by 0.3 percent to $254,300 and vacant land increased by 1.8 percent to $140,000.
Over the 12 months to December 2015, median sale prices in country Victoria showed a 2.8 percent increase for houses, a 1.7 percent increase for units and a 1.8 percent decrease for vacant land.
Of the 739 listed Victorian locations, 289 had median house price increases for the December 2015 quarter compared to 330 in the September 2015 quarter.
Seven localities recorded no change, 209 showed a decrease and 234 had insufficient sales.
The maximum number of house sales for the quarter was 247 in Pakenham. There were 32 locations with 100 or more sales in the December 2015 quarter.
House sales data for the whole of Victoria for the quarter ending December 2015 indicates that the median house sale price increased by 4 percent to $520,000. Metropolitan house prices increased by 3.3 percent to $630,000 and country Victoria House prices increased by 3.6 percent to $316,000.
Quoting the highest and lowest increases and decreases for the quarter does not necessarily provide a definitive indication of the property market. However, the examples of sub-market groupings provided – defined by regional suburb location and township size – may be useful for analysis and comparison.
The use of simple comparisons – increases and decreases in median prices between similar suburbs or towns – disregards the number of sales comprising the median and can be misleading in some instances. It should be remembered that suburbs and towns with higher numbers of sales provide the best guide to trends.
Property analysts will be able to define and explain various locations’ trends using their knowledge of individual locations and their associated sub-market anomalies. This is the purpose of publishing a comprehensive set of data for the whole of Victoria, as reported to Land Victoria over the 15 months to December 2015. A sub-market group is a set of properties grouped by land values and other market characteristics or attributes common to the group, such as land use or building construction.
It is estimated that almost 93 percent of sales for the December quarter of 2015 and 98 per cent for the September quarter of 2015 are included in the data, making it the most comprehensive and authoritative property information available. By allowing extra time for data collection, the Victorian Property Sales Report provides an accurate picture of the property market, which offers certainty to government, the property industry, purchasers and sellers.
The number of Victorian house sales so far recorded for the December 2015 quarter is 21,379. Using the above percentage, it is anticipated that the number of sales for the December 2015 quarter will be approximately 22,988. This is a 2.1 per cent increase from the number of sales in the September 2015 quarter and a 1.2 per cent decrease on the same quarter the previous year (December 2014).
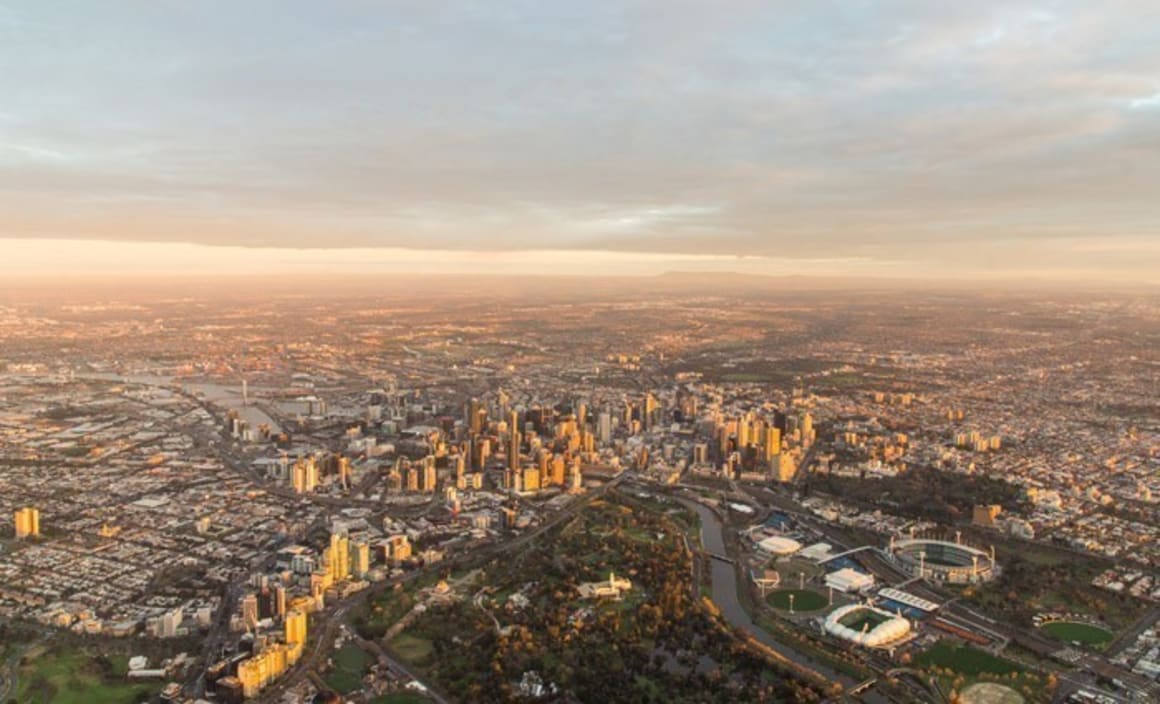
Metropolitan Melbourne
House prices in metropolitan Melbourne increased by 3.3 percent in the December 2015 quarter, from $610,000 to $630,000. This follows a 3.4 percent increase in the previous quarter. The number of metropolitan sales for the quarter is expected to culminate at 16,578, which is 1.6 percent higher than the September 2015 quarter and 3.9 percent lower than the December 2014 quarter.
The data indicates that the driving factor in the 3.3 percent increase in metropolitan Melbourne housing values were localities within 20 km of Melbourne, predominately the inner Eastern suburbs. The following table demonstrates the volatility in median house price changes and indicates the need for data analysts to undertake their own detailed research. It has generally been observed that there are fewer suburbs showing an increase in median house price in the December 2015 quarter compared to the September 2015 quarter (187 metropolitan suburbs with 10 or more sales show an increase in median house price for this quarter, compared to 234 suburbs in the September 2015 quarter).
One hundred and fifteen metropolitan suburbs with 10 or more sales in both of the last two quarters shifted from showing a median price increase for the September 2015 quarter to a median price decrease for the December 2015 quarter. For example, Heidelberg increased by 16.1 percent in the September 2015 quarter, while it showed a 9.4 percent decrease in the December 2015 quarter. This compares to 94 metropolitan suburbs shifting from an increase in the June 2015 quarter to a decrease in the September 2015 quarter.
Conversely, 68 metropolitan suburbs with 10 or more sales shifted from showing a median price decrease for the September 2015 quarter to a median price increase for the December 2015 quarter. This compares to 69 metropolitan suburbs shifting from a decrease in the June 2015 quarter to an increase in the September 2015 quarter.
Thirty-three metropolitan suburbs with 10 or more sales showed decreases for both the September 2015 and December 2015 quarters. Significant examples include Malvern and Canterbury. This is compared to eight metropolitan suburbs in the previous quarter.
The biggest median price increase in a suburb with 10 or more sales occurred in South Melbourne, which had 24 sales and rose by 34.9 percent ($1,017,500 to $1,372,500). The next biggest increase in the Melbourne metropolitan area occurred in Yarra Junction, which had 14 sales and rose by 20 percent to $435,000.
For the quarter, Fitzroy North had the largest median house price decrease in a metropolitan suburb with 10 or more sales. It had 29 house sales and its median house price decreased by 23.4 percent, from $1,370,000 to $1,050,000. Black Rock experienced the second highest median price decrease in metropolitan Melbourne. It had 22 sales and its median price decreased by 23 percent from $1,842,500 to $1,418,000.
Melton’s median price of $261,500 was the lowest for metropolitan suburbs in the December 2015 quarter. The median house price increased by 5 per cent from the September 2015 quarter.
Toorak continued to have the highest median price at $3,057,500, decreases of 18.5 per cent from the previous quarter and 0.9 per cent for the 12 months from December 2014.
Inner suburbs (within 10 km of Melbourne CBD)
Suburb | December quarter 2014 $ | September quarter 2015 $ | December quarter 2015 $ | % change December 2014–2015 | % change September 2015–December 2015 |
Ascot Vale | 875000 | 872500 | 900000 | 2.9 | 3.2 |
Brunswick | 800000 | 890000 | 898000 | 12.3 | 0.9 |
1260000 | 1400000 | 1325000 | 5.2 | -5.4 | |
Fitzroy North | 965000 | 1370000 | 1050000 | 8.8 | -23.4 |
Flemington | 760000 | 823000 | 811800 | 6.8 | -1.4 |
650000 | 675000 | 729000 | 12.2 | 8.0 | |
1641000 | 1857500 | 2001300 | 22 | 7.7 | |
Malvern | 1950000 | 2140000 | 1970000 | 1.0 | -7.9 |
Preston | 708000 | 815000 | 810000 | 14.4 | -0.6 |
Richmond | 1030000 | 1065000 | 1204000 | 16.9 | 13.1 |
1042000 | 1017500 | 1372500 | 31.7 | 34.9 | |
South Yarra | 1402500 | 1850000 | 1700000 | 21.2 | -8.1 |
1105000 | 1152500 | 1001000 | -9.4 | -13.1 | |
3085000 | 3752500 | 3057500 | -0.9 | -18.5 | |
Williamstown | 980000 | 1117500 | 1120000 | 14.3 | 0.2 |
Eastern suburbs (10–20 km from Melbourne CBD)
Suburb | December quarter 2014 $ | September quarter 2015 $ | December quarter 2015 $ | % change December 2014–2015 | % change September 2015–December 2015 |
1800000 | 2225000 | 2060000 | 14.4 | -7.4 | |
Blackburn | 967500 | 1200000 | 1233000 | 27.4 | 2.8 |
Box Hill North | 945000 | 1150000 | 1012500 | 7.1 | -12.0 |
1002500 | 1201800 | 1160000 | 15.7 | -3.5 | |
Burwood | 925000 | 1247500 | 1125000 | 21.6 | -9.8 |
1742500 | 2005000 | 1805000 | 3.6 | -10.0 | |
1615000 | 1760000 | 1868500 | 15.7 | 6.2 | |
712500 | 840000 | 861000 | 20.8 | 2.5 | |
Surrey Hills | 1520000 | 1875000 | 1721000 | 13.2 | -8.2 |
Western suburbs (10–20 km from Melbourne CBD)
Suburb | December quarter 2014 $ | September quarter 2015 $ | December quarter 2015 $ | % change December 2014–2015 | % change September 2015–December 2015 |
Altona | 612000 | 715000 | 749000 | 22.4 | 4.8 |
582500 | 550000 | 597800 | 2.6 | 8.7 | |
Deer Park | 370000 | 400000 | 395000 | 6.8 | -1.3 |
Derrimut | 420000 | 490000 | 508500 | 21.1 | 3.8 |
Keilor East | 610000 | 705000 | 695300 | 14.0 | -1.4 |
St Albans | 387000 | 435500 | 451000 | 16.5 | 3.6 |
Sunshine | 491000 | 567500 | 623000 | 26.9 | 9.8 |
Sunshine West | 415000 | 485000 | 490000 | 18.1 | 1.0 |
Outer-western suburbs (20+ km from Melbourne CBD)
Suburb | December quarter 2014 $ | September quarter 2015 $ | December quarter 2015 $ | % change December 2014–2015 | % change September 2015–December 2015 |
Burnside Heights | 436000 | 452000 | 510000 | 17 | 12.8 |
Caroline Springs | 475000 | 492000 | 503500 | 6.0 | 2.3 |
Hoppers Crossing | 342500 | 374000 | 375000 | 9.5 | 0.3 |
460000 | 505000 | 506500 | 10.1 | 0.3 | |
Sydenham | 410000 | 445000 | 446500 | 8.9 | 0.3 |
Tarneit | 400000 | 405000 | 410000 | 2.5 | 1.2 |
Taylors Hill | 494000 | 523000 | 542500 | 9.8 | 3.7 |
Werribee | 333800 | 335500 | 359300 | 7.6 | 7.1 |
Outer-eastern suburbs (20+ km from Melbourne CBD)
Suburb | December quarter 2014 $ | September quarter 2015 $ | December quarter 2015 $ | % change December 2014–2015 | % change September 2015–December 2015 |
Bayswater | 562000 | 638900 | 635000 | 13.0 | -0.6 |
Bayswater North | 500000 | 592000 | 580000 | 16.0 | -2.0 |
Boronia | 530400 | 619000 | 575600 | 8.5 | -7.0 |
Ferntree Gully | 525200 | 618500 | 600000 | 14.2 | -3.0 |
Heathmont | 687000 | 778000 | 775000 | 12.8 | -0.4 |
Knoxfield | 593800 | 745000 | 705000 | 18.7 | -5.4 |
Wantirna | 700000 | 820000 | 831500 | 18.8 | 1.4 |
Country Victoria
Country Victoria’s median house price increased by 3.6 percent to $316,000 in the December 2015 quarter. Over the 12 months to December 2015, the median house price in country Victoria increased by 2.8 percent from $307,500.
The number of country Victoria House sales for the December 2015 quarter is expected to be 6,410, which is 6.4 percent more than the December 2014 quarter.
A comparison of house prices in regional, seaside and large towns also indicates various trends.
Regional cities
Suburbs in regional cities | December quarter 2014 $ | September quarter 2015 $ | December quarter 2015 $ | % change December 2014–2015 | % change September 2015–December 2015 |
Ballarat Central | 350000 | 325000 | 345000 | -1.4 | 6.2 |
Bendigo | 338300 | 312000 | 385000 | 13.8 | 23.4 |
531000 | 599000 | 633500 | 19.3 | 5.8 | |
Horsham | 220000 | 225000 | 239500 | 8.9 | 6.4 |
Mildura | 248000 | 250400 | 260000 | 4.8 | 3.9 |
Shepparton | 256500 | 240000 | 263300 | 2.6 | 9.7 |
Warrnambool | 322500 | 320000 | 338300 | 4.9 | 5.7 |
Wodonga | 298000 | 279000 | 295000 | -1.0 | 5.7 |
Regional city housing markets showed similar trends for the December 2015 quarter. Bendigo median house prices increased by 23.4 percent, having decreased by 10.9 percent in the previous quarter. Mildura increased by 3.9 percent for the December 2015 quarter, having increased by 6.6 percent in the previous quarter.
Large towns
Suburbs in large towns | December quarter 2014 $ | September quarter 2015 $ | December quarter 2015 $ | % change December 2014–2015 | % change September 2015–December 2015 |
Bairnsdale | 229800 | 210000 | 250000 | 8.8 | 19.0 |
Castlemaine | 396300 | 380000 | 395000 | -0.3 | 3.9 |
Colac | 242000 | 237500 | 244000 | 0.8 | 2.7 |
Echuca | 307500 | 300000 | 305000 | -0.8 | 1.7 |
Hamilton | 175500 | 212500 | 215000 | 22.5 | 1.2 |
Moe | 175000 | 160000 | 168000 | -4.0 | 5.0 |
Morwell | 138300 | 168800 | 165000 | 19.3 | -2.2 |
Sale | 300000 | 295000 | 308000 | 2.7 | 4.4 |
Swan Hill | 229000 | 270000 | 268000 | 17.0 | -0.7 |
Traralgon | 265000 | 265000 | 298000 | 12.5 | 12.5 |
Wangaratta | 270000 | 283500 | 270800 | 0.3 | -4.5 |
Yarrawonga | 285000 | 301500 | 340000 | 19.3 | 12.8 |
The sample of large towns is the same used in the previous quarter’s report. It shows that nine of the 12 large towns had increases in median house prices for the December 2015 quarter. The September 2015 quarter showed increases for eight towns and the June 2015 quarter showed increases for nine towns.
Bairnsdale had an increase of 19 percent for the December 2015 quarter, having decreased by 15.2 percent in the previous quarter. Wangaratta decreased by 4.5 per cent and Traralgon increased by 12.5 percent. Sale increased by 4.4 percent for the December 2015 quarter, having increased in the previous quarter by 3.9 percent.
Seaside towns
Seaside towns | December quarter 2014 $ | September quarter 2015 $ | December quarter 2015 $ | % change December 2014–2015 | % change September 2015–December 2015 |
Anglesea | 610000 | 635000 | 700000 | 14.8 | 10.2 |
Barwon Heads | 775000 | 725000 | 835000 | 7.7 | 15.2 |
Cowes | 385000 | 420000 | 437200 | 13.6 | 4.1 |
Inverloch | 434500 | 422500 | 435000 | 0.1 | 3.0 |
Lakes Entrance | 264000 | 290000 | 255000 | -3.4 | -12.1 |
Lorne | 815000 | 770000 | 997500 | 22.4 | 29.5 |
Portland | 197500 | 223500 | 224500 | 13.7 | 0.4 |
St Leonards | 352800 | 366000 | 458500 | 30.0 | 25.3 |
Torquay | 585000 | 660000 | 658100 | 12.5 | -0.3 |
Venus Bay | 230000 | 232000 | 265500 | 15.4 | 14.4 |
The sample of seaside towns shows that eight of the 10 towns selected had increases in their median house prices from the September 2015 to December 2015 quarters. Anglesea increased by 10.2 percent, having increased by 8.1 percent during the previous quarter. Cowes median house price increased by 4.1 percent for the December 2015 quarter, having increased by 1.1 percent in the previous quarter. Venus Bay median house price increased by 14.4 percent for the December 2015 quarter, having increased by 3.1 percent in the previous quarter.
Robert Marsh is Victorian Valuer-General and can be contacted here.