Winners and losers on population growth: CommSec's Craig James

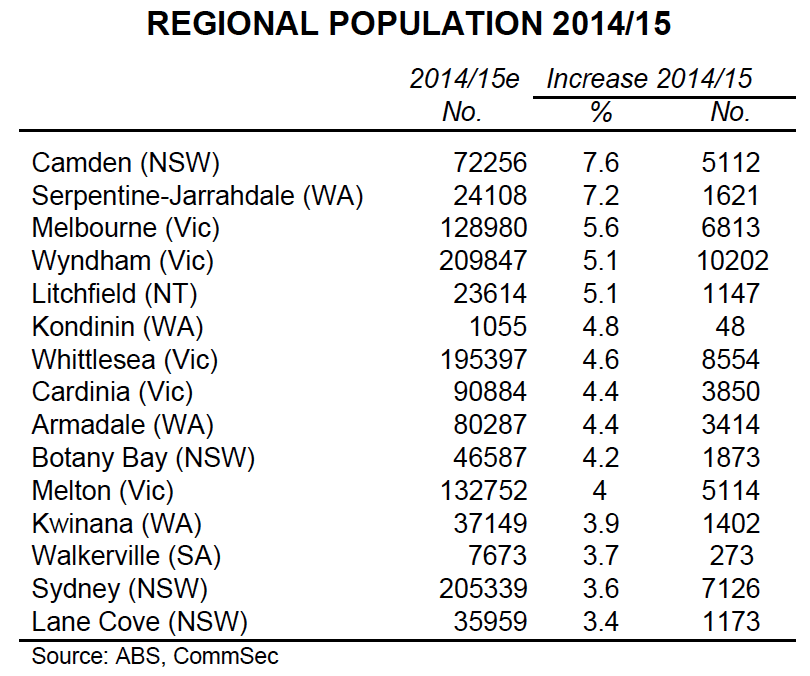
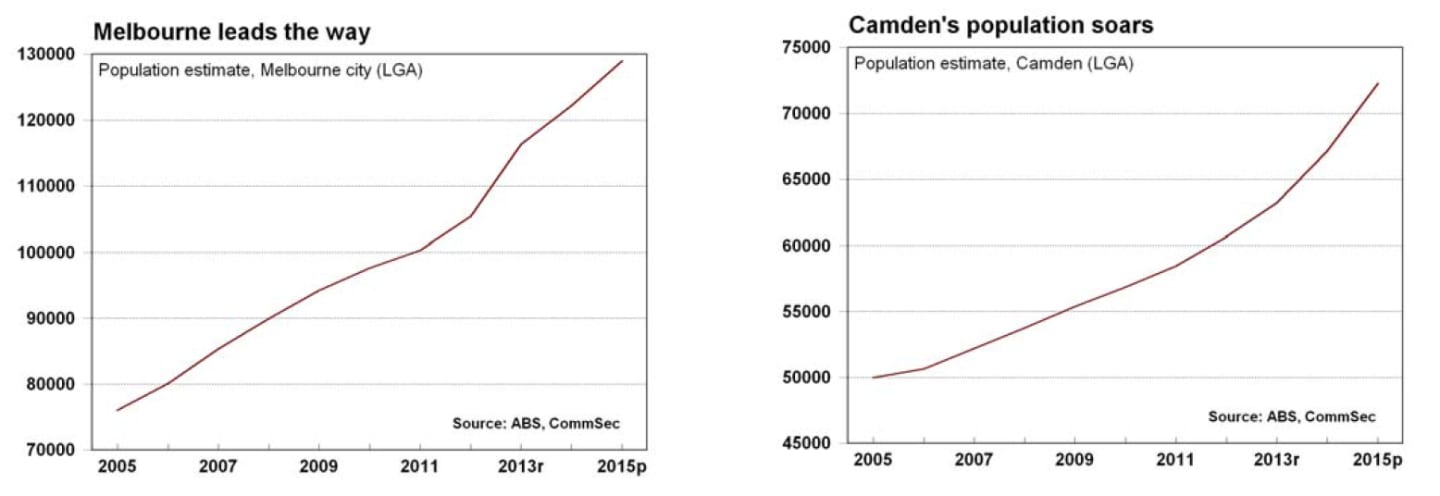
In 2014/15, Camden in south-west Sydney recorded the fastest population growth rates for local government areas, up by over 5,000 people or 7.6 percent. The Melbourne City LGA grew by over 6,800 people or 5.6 percent in 2014/15.
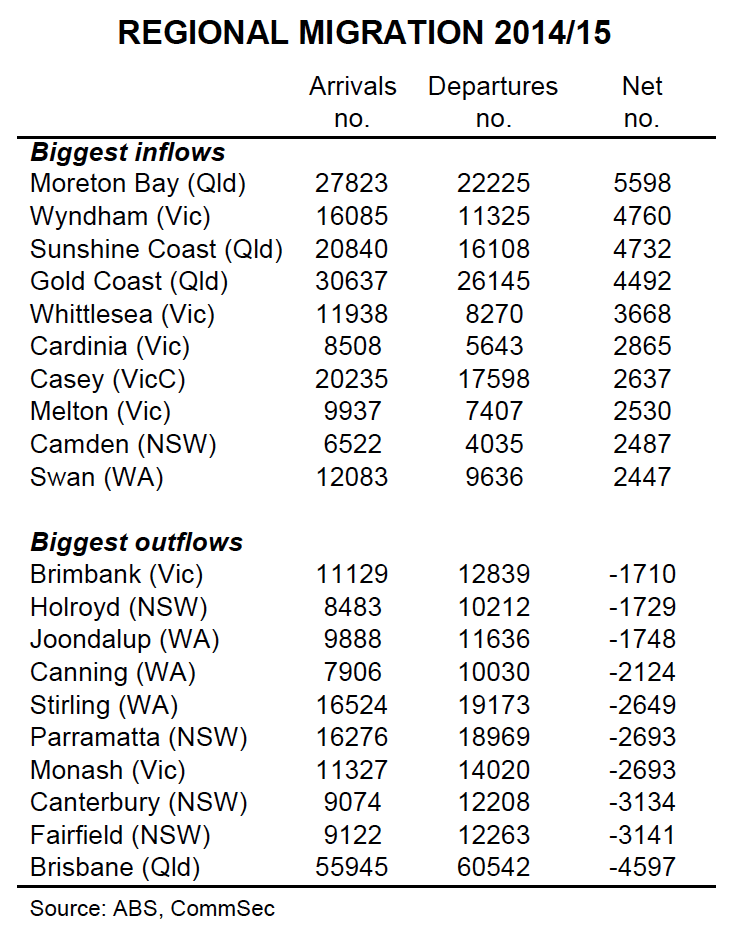
Regional migration: In 2014/15, Moreton Bay in Queensland recorded the biggest inflow of people (5,598) while Brisbane recorded the biggest outflow of people (4,597).
Regional population: Melbourne was the fastest growing capital city in 2014/15 with population growing by 91,600 people or 2.1 percent.
Overseas Migration: Latest data shows that 28.2 percent of Australians were born overseas – the highest proportion for over 120 years.
The demographic data have implications for all businesses, especially those located in rural and regional areas which are looking to target the fastest growing regions.

What does it all mean?
For any business, it’s important to track your catchment area – determine whether population is advancing or declining as well as determining whether there are other regions that represent greater opportunities.
The Bureau of Statistics provides population estimates at different levels, allowing businesses to cut and dice figures a number of different ways.
What stands out is the outflow of people from Western Australian mining areas in the last financial year and the big population gains in the new housing areas of Victoria, and to a lesser extent, NSW.
A number of Queensland areas recorded significant inflows of people last financial year, notably the Gold Coast, with net migration the largest in eight years. The Sunshine Coast also recorded notable inflows of people for the second year.
Queensland is notable for the ‘churn’ factor – the high level of people arriving and departing from regions each year with Brisbane highest from the Gold Coast.
It is clear that there are tremendous opportunities for businesses with a raft of regions recording solid population growth rates. The number of people in Lane Cove in
Sydney’s north has lifted sharply over the past two year largely on apartment demand than free-standing homes.
What do the figures show?
Overseas Migration 2014/15
The Australian Bureau of Statistics (ABS) estimates that net overseas migration eased from 186,365 to 168,183 in the 2014/15 financial year.
All states and territories recorded a net inflow of migrants in 2014/15 with NSW (39.3 percent) and Victoria (32.1 percent) dominating the share of net migrants coming to Australia.
As at June 2015, 28.2 percent of all Australians were born overseas, up from 28.1 percent in 2014 and the highest share since 1894.
The ABS is only able to determine why migrants came to Australia with a lag, that is “An individual's actual travel behaviour and associated characteristics, including visa type, are only available from final NOM data, as these can only be accurately determined at the end of the 16 month reference period following a traveller's initial border crossing.”
In 2013/14, 67 percent of net migration to Australia was by people on temporary visas, notably higher education (28.3 percent), ‘visitor’ (17.7 percent and ‘working holiday’ (14.7 percent).
Regional Migration 2014/15
In 2014/15, 339,000 people moved interstate, down 2.9 per cent (10,190 people) on the previous year. Only Victoria (+10,200) and Queensland (+6,417) recorded a positive net increase of people by way of interstate migration.
The region with the biggest net inflow of people was the Moreton Bay local government area in Queensland with almost 5,600 moving into the region. Next highest was Wyndham in Victoria (up 4,760), Sunshine Coast in Queensland (up 4,732) and Gold Coast (up 4,492).
The region with the biggest net outflow of people was Brisbane (down 4,597).

Regional population 2014/15
In 2014/15, Camden in south-west Sydney recorded the fastest population growth rates for local government areas, up by 5,112 people or 7.6 percent. Camden’s population growth has accelerated over the past five years.
Of the 563 local government areas, 336 regions recorded positive population growth in the year to June 2015.
Western Australia dominated the regions recording the biggest declines in population, recording all of the 17 biggest percentage falls.
The ABS has provided further observations on population:

“The combined population of Greater Capital Cities increased by 263,100 people (1.7 percent) between 30 June 2014 and 30 June 2015, accounting for 83 percent of the country's total population growth.
Melbourne had the largest growth of all Greater Capital Cities (up by 91,600 people), followed by Sydney (83,300), Brisbane (35,200) and Perth (31,100).
Melbourne also had the fastest growth (up by 2.1 percent), ahead of Darwin (1.9 percent) and Sydney (1.7 percent).
The top four Statistical Areas Level 2 (SA2s) with the largest population growth in Australia were outer suburbs of Greater Melbourne.
The SA2 of ACT - South West had the fastest growth (up 127 percent), followed by Cranbourne East in Greater Melbourne (32 percent).
Wyndham in Melbourne's west had the highest net migration gain of all Statistical Areas Level 3 (SA3s) in Australia in 2014-15 (4,900 people). It was one of a number of SA3s in Melbourne's outer suburban fringe to have comparatively high net migration growth. These included Whittlesea - Wallan (4,100), Casey - South (4,000) and Melton - Bacchus Marsh (3,300) in Melbourne's north-east, south-east and west respectively.
The SA3s with the highest net losses in 2014-15 were Canterbury (-3,300 people) in Sydney's inner southwest, Strathfield - Burwood - Ashfield and Fairfield (both -3,100) in Sydney's inner-west and south-west respectively, and Monash (-2,600) in Melbourne's south-east.”
What is the importance of the economic data?
The Australian Bureau of Statistics (ABS) provides detailed annual population estimates, including data on migration and population changes in regional areas.
What are the implications?
Population growth has slowed at a broad, Australia-wide level, but there are marked variations beneath the surface. As would be expected, the ending of the mining construction boom has led to an outflow of people from a raft of Western Australian regions. Population growth is fastest in Victoria and there remains high numbers of Aussies, and newly-arrived, migrants, trying out the lifestyle in Queensland. Good social infrastructure will be important if Queensland regions are successful in retaining the new arrivals.
The ABS has continued to highlight net migration losses in Sydney from Canterbury, Strathfield, Burwood, Ashfield and Fairfield. In Melbourne there continue to be outflows of people from Dandenong and Monash in the south-east but inflows to the north-east, south-east and western suburbs of Melbourne.
The latest population estimates are of importance to private and public sector businesses alike whether it is the location of stores or planning of transport and social infrastructure. Poor transport and infrastructure could lead to population outflows affecting business revenues and council rates.
A good economy is important for holding onto people. Fewer people left NSW in the last financial year, basically because job opportunities had improved. And the number of people leaving NSW was sharply lower than over the previous decade despite weaker housing affordability.
Craig James is the chief economist at CommSec.