
CommSec's State of the States shows NSW as best performing economy: Craig James

GUEST OBSERVER
How are Australia’s states and territories performing? Each quarter CommSec attempts to find out by analysing eight key indicators: economic growth; retail spending; equipment investment; unemployment; construction work done; population growth; housing finance and dwelling commencements.
Just as the Reserve Bank uses long-term averages to determine the level of ‘normal’ interest rates; we have done the same with key economic indicators. For each state and territory, latest readings for the key indicators were compared with decade averages – that is, against the ‘normal’ performance.
NSW has retained top spot as the best performing economy, edging a little further ahead of Victoria. Both states are maintaining a healthy lead over the other states and territories.
The big change over the past quarter has been the lift of the ACT economy to equal third position alongside the Northern Territory. Western Australia has dropped from fourth to fifth. But there is little to separate the ACT and the Northern Territory in the second grouping of economies. In the third grouping of state and territory economies, Queensland is sixth ranked, ahead of the South Australia (seventh) and Tasmania (eighth).
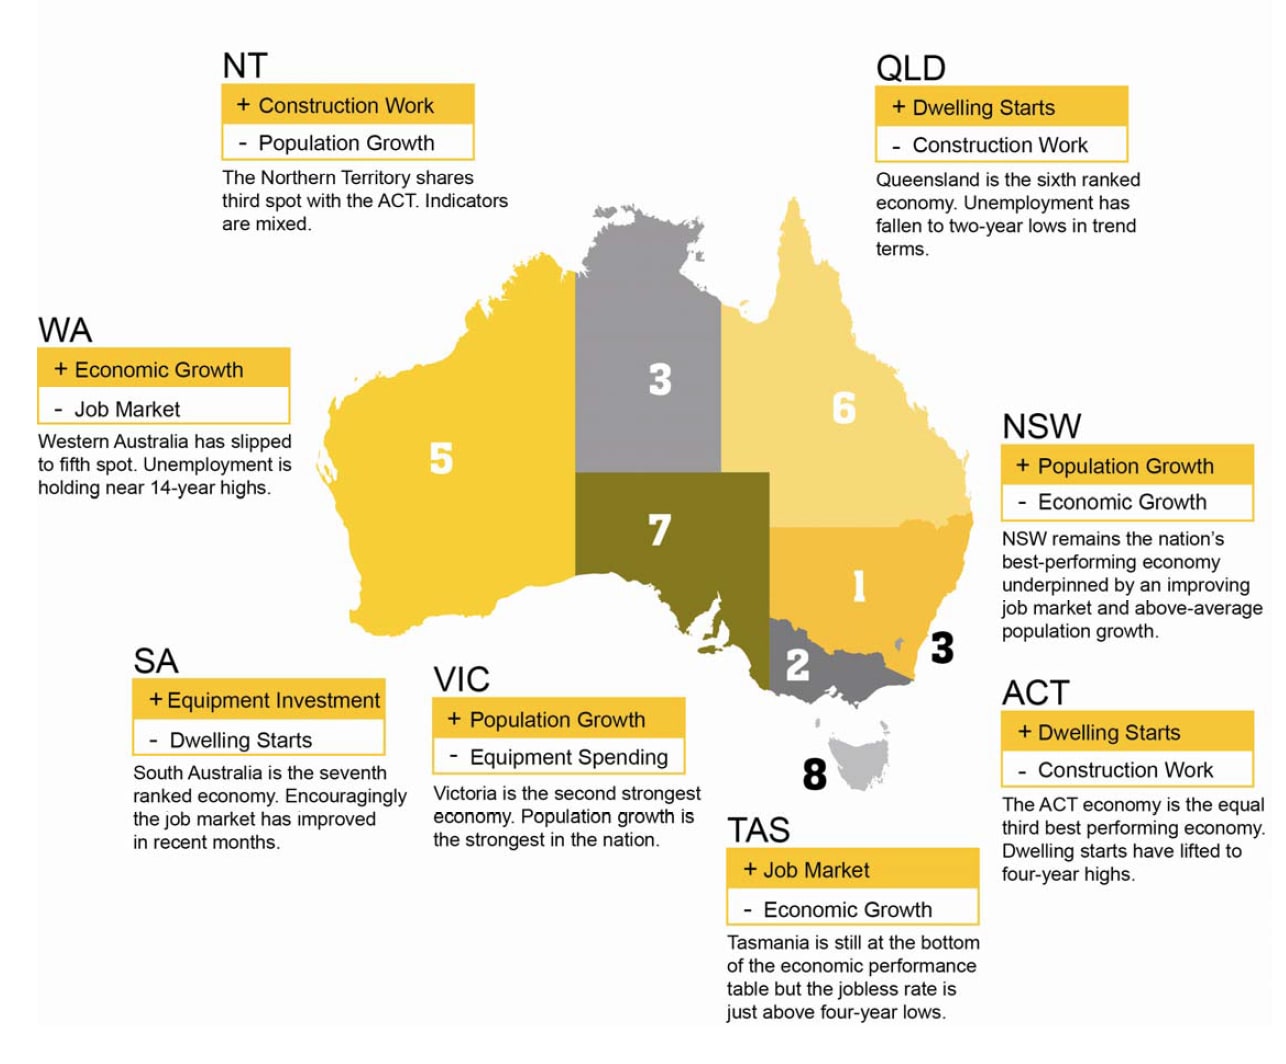
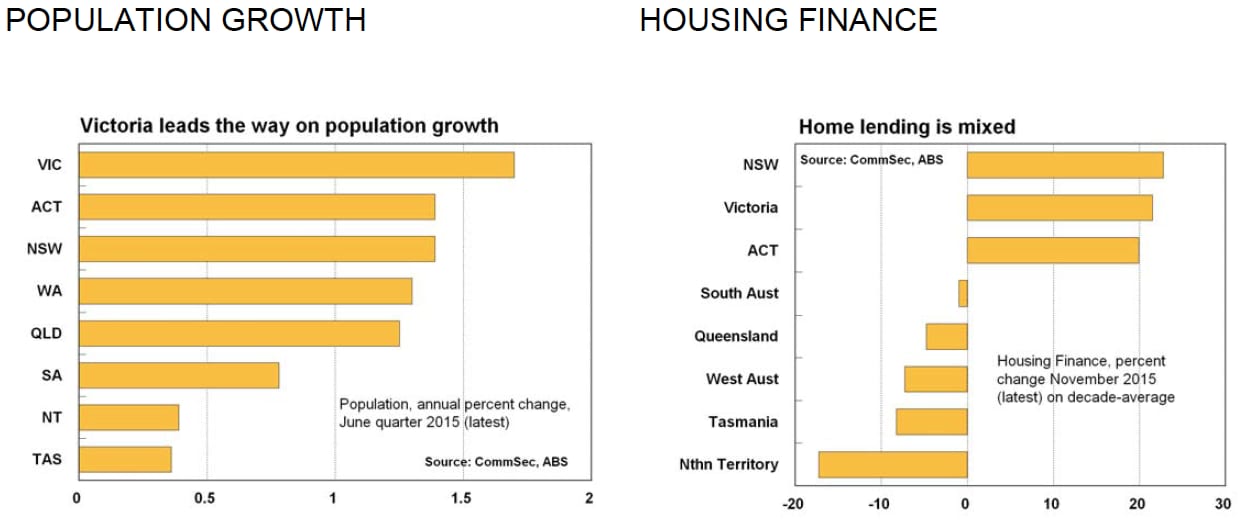
NSW has retained its top rankings on population growth, retail trade, dwelling starts and housing finance but now adds unemployment and equipment investment to the list. NSW is still fourth-ranked on construction work done and fifth ranked on economic growth.
Victoria has lost a little ground on NSW but is solidly in second spot on the economic performance rankings. Victoria’s main strengths are population growth and housing finance (second ranked) and dwelling starts and retail trade (third ranked on each indicator).
The Northern Territory remains the third ranked economy, but now shares that position with the other territory – the Australian Capital Territory.
Northern Territory is top ranked on construction work done and is second ranked on economic growth, business investment and unemployment. But the ‘top end’ economy is last ranked on population growth and housing finance.
The ACT economy lifted to equal third courtesy of improved rankings on equipment investment and dwelling starts. The ACT is also third ranked on economic growth, population growth and housing finance. Western Australia is in fifth spot on the economic performance rankings. While top ranked on economic growth, it is bottom ranked on equipment investment and unemployment.
Queensland is now in sixth position on the economic performance table. Best rankings are retail trade and dwelling starts (fourth ranked on each indicator). South Australia remains in seventh spot on the economic performance rankings.
South Australia does best on population growth and housing finance (both fourth ranked) but is seventh or eighth on three indicators. Tasmania remains at the bottom of the Australian economic performance table. Tasmania is third ranked on unemployment (previously first) and weakened from third to sixth on housing finance.
Ideally gross state product (GSP) would be used to assess broad economic growth. But the data isn’t available quarterly. Rather, state final demand (household and business spending) is added to exports less imports to act as a proxy for GSP.
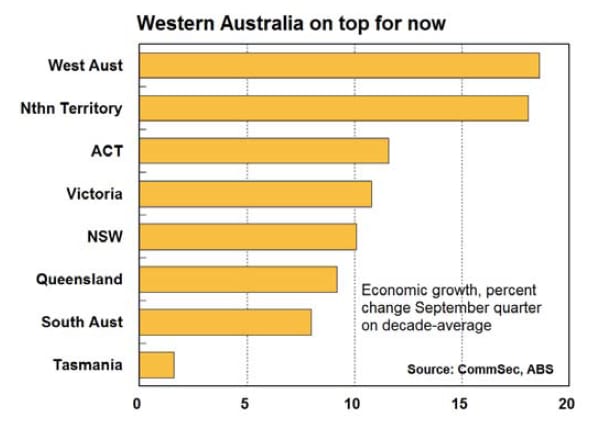
Exclusion of the trade sector would provide an incorrect assessment of growth for economies such as Western Australia and Queensland. The only major change in the rankings since the last quarter has been at the top of the leader-board with Western Australia now on top from Northern Territory.
Now while economic growth has slowed in both economies over the past year, the current level of economic activity is still higher than the ‘normal’ or decade-average level of output in percentage terms than the comparison for other economies.
Western Australian output is just under 19 per cent higher than the decade average level of output, from Northern Territory (18.1 per cent), ACT (up 11.6 per cent), Victoria (up 10.8 per cent) and NSW (up 10.1 per cent).
At the other end of the scale, economic activity in Tasmania in the September quarter was just 1.6 per cent above its decade average, while South Australian activity was higher by 8 per cent and Queensland economic activity up by 9.2 per cent.
Victoria now has the fastest annual economic growth rate in the nation, up by 3.4 per cent on a year ago, ahead of ACT with 2.6 per cent and Tasmania (2.3 per cent). By contrast, the Northern Territory economy is down 13.9 per cent on a year ago, while Western Australian economic activity is down 1.6 per cent on a year ago with the Queensland economy down 0.2 per cent on a year ago.
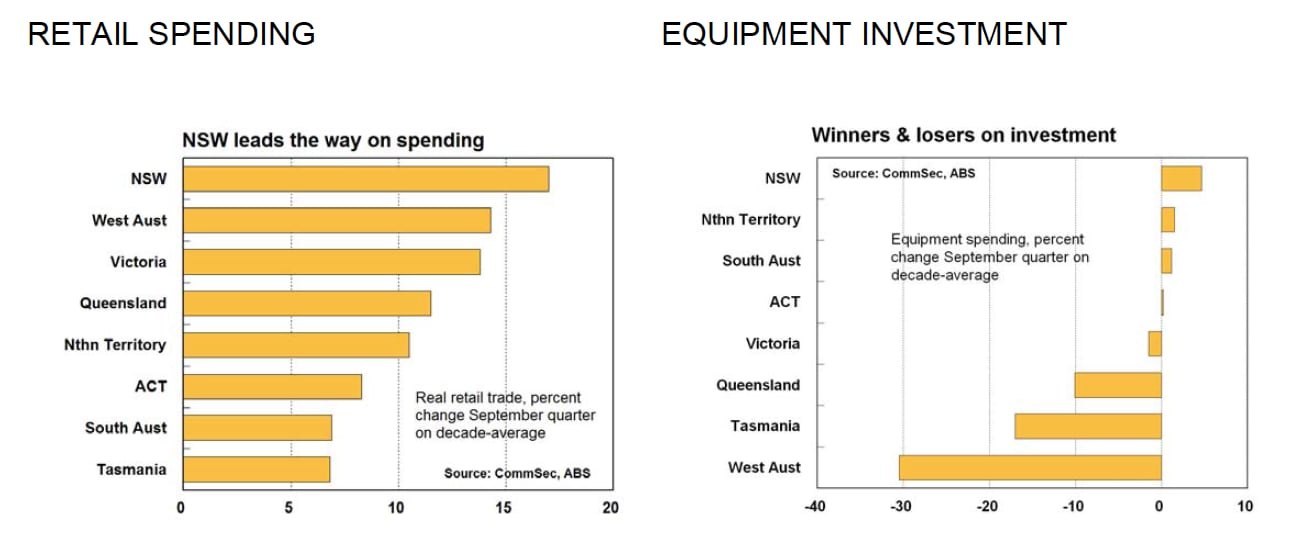
The measure used was real (inflation-adjusted) retail trade in trend terms with September quarter data the latest available. NSW has held on to the top spot on the retail rankings from Western Australia and Victoria with spending in the September quarter 17.0 per cent above decade-average levels. Solid activity in the housing sector, lower unemployment and higher home prices are supporting spending.
Spending in Western Australia was 14.3 per cent above decade-average levels with a legacy of the mining boom – higher income levels – supporting spending. Spending in Victoria was up 13.8 per cent on the decade average followed by Queensland (up 11.5 per cent).
In fifth spot was the Northern Territory with spending 10.5 per cent above decade averages. Tasmania continues to record the weakest result on retail spending, up 6.8 per cent on the decade average, just below South Australia with 6.9 per cent growth and the ACT with 8.3 per cent growth.
If monthly retail trade was assessed instead to calculate the rankings (November data available), the rankings would be slightly different with Victoria in second spot and South Australia in eighth position. In terms of annual growth of real retail trade, Victoria is strongest, up 4.0 per cent, from NSW, up 3.7 per cent, and South Australia, up 3.6 per cent.
And looking at monthly retail trade, the strongest annual growth is again in Victoria (up 5.8 per cent) from Tasmania (up 4.8 per cent) and NSW (up 4.7 per cent).
NSW is now on top on equipment investment from the Northern Territory, further highlighting the transition in the economy after the resources boom. Equipment spending in the September quarter was just under 5 per cent above ‘normal’ – or decade-average levels.
In the June quarter Northern Territory equipment spending was 20.2 per cent above decade-averages. Now spending is up by just 1.5 per cent. South Australia has held onto third spot, up 1.2 per cent above decade-average levels, followed by ACT (up 0.2 per cent). By contrast, other states and territories had equipment spending below decade averages in the September quarter.
Weakest was Western Australia (down 30.5 per cent) followed by Tasmania (down 17.0 per cent) and Queensland (down 10.1 per cent). Equipment spending in Victoria was down on decade average levels, but just by 1.5 per cent. On a shorter-run analysis, equipment investment in the September quarter was higher than a year ago in only three of the state and territory economies (last quarter, five states and territories had equipment spending up on a year ago).
Equipment investment is up the most on a year ago in the ACT (up 12.6 per cent), followed by Tasmania (up 7.8 per cent) and Victoria (up 2.7 per cent). By contrast new equipment investment in the Northern Territory was down 30.6 per cent on a year ago while spending in Western Australia was down 30.1 per cent with Queensland down 10.3 per cent.
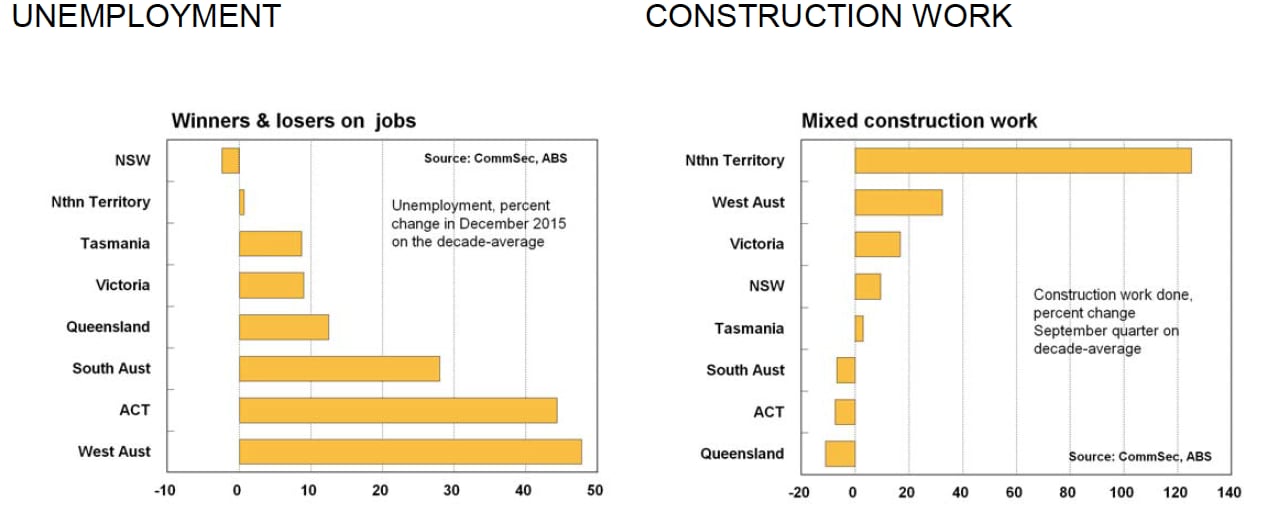
Which state or territory has the strongest job market in the nation? It is not an easy question to answer. The lowest trend unemployment rate in Australia can be found in the Northern Territory at 4.1 per cent from NSW and the ACT at 5.2 per cent. But the ACT jobless rate is over 44 per cent above its decade average. And Northern Territory’s jobless rate is 0.7 per cent above its decade average (“normal”) jobless rate.
However the NSW jobless rate is actually 2.4 per cent lower than the decade average. In further comparing current jobless rates in each state and territory with their respective decade averages, Tasmania follows NSW and Northern Territory, its 6.6 per cent jobless rate is 8.7 per cent above the decade average.
In Victoria, unemployment stands at 5.9 per cent, up 9.0 per cent on its decade average of 5.4 per cent. At the other end of the scale is Western Australia. Trend unemployment stands at 6.4 per cent, 47.8 per cent higher than the 4.3 per cent ‘normal’ or decade-average. Next weakest is the ACT – as noted above the trend unemployment rate is 44.4 per cent above the decade average.
South Australia’s jobless rate is 28 per cent above the decade average, while Queensland is mid pack – its 5.9 per cent jobless rate is up 12.5 per cent on the ‘normal’ level. Unemployment rates in NSW, Victoria, Queensland, South Australia and Northern Territory have all eased in trend terms in the past three months.
The measure used for analysis was the total real value of residential, commercial and engineering work actually completed in trend terms in the September quarter. In five of the states and territories, construction work was higher than decade averages.
Leading the way was the Northern Territory with construction work done almost 117 per cent above its decade average with activity associated with the gas projects providing solid support. Next strongest was Western Australia (up 35.1 per cent) while construction work done in Victoria was up by 17.2 per cent on ‘normal’ levels in trend terms. Construction work done in both economies was well up on a year ago in the September quarter.
NSW is fourth ranked with construction work 7.2 per cent above decade averages. Tasmania is fifth ranked with construction work 0.7 per cent above ‘normal’ levels. In Queensland, overall new construction work completed in the September quarter was almost 19 per cent below the decade average, weaker than the 11 per cent decline recorded in the June quarter.
Next weakest to Queensland was the ACT where construction work was 12.1 per cent below decade averages, followed by South Australia (down 1.6 per cent). In terms of annual growth rates, Western Australian construction work done in the September quarter was up 13.3 per cent on a year ago, followed by Victoria, up 11.5 per cent. Other economies had construction work lower than a year ago, led by Queensland, down by 30.5 per cent – the biggest annual decline in records going back over 26 years.
The measure used was the trend number of dwelling commencements (starts) with the comparison made to the decade-average level of starts. Starts are driven in part by population growth and housing finance and can affect retail trade, unemployment and overall economic growth. However any over-building or under-building in previous years can affect the current level of starts.
The outlook for home building remains strong over the next year but a slowdown can be expected later in 2016 as the surge in the supply of new homes meets pent-up demand. The slowdown in population growth will also restrain future home building. NSW retains the mantle of the strongest in the nation for new home construction, with starts almost 72 per cent above decade averages.
In addition, in the September quarter the number of dwellings started was 24.6 per cent higher than a year earlier. The ACT has replaced Victoria in second spot, with starts 48.2 per cent above decade averages. Victorian starts are 38.3 per cent above decade averages and Queensland starts are up 26.7 per cent. At the other end of the scale, South Australian dwelling starts were 3.0 per cent below decade averages.
And in the September quarter starts were down 2.6 per cent on a year earlier. Next weakest was Northern Territory (down 2.8 per cent from decade highs) from Tasmania (up 12.6 per cent on the decade average) and Western Australia (up 16.1 per cent on the decade average). In terms of annual growth, the ACT is strongest with dwelling starts at record highs in trend terms in the September quarter, up 44.3 per cent on a year ago.
In the June quarter, NSW was alone in recording a fall in real wages. However in the September quarter, wage growth in all states and territories was above that of consumer prices.
Strongest real wage growth was again recorded in the Northern Territory with wages 2.0 percentage points (pp) higher than consumer prices. Wage growth was second highest in the nation while inflation was the lowest. Real wage growth was next highest in three economies – Victoria, South Australia and Tasmania – with wages 1.2pp above consumer prices (inflation).
At the other end of the scale, NSW wage growth of 2.2 per cent was just above the 1.9 per cent annual growth of prices. Despite that, retail spending still remains firm in NSW. Real wages remains only modestly positive in Queensland (+0.5pp) and Western Australia (+0.9pp).
Turning to home prices, in December four of the capital cities had positive annual growth of home prices. Back in June, similarly four of Australia’s capital cities had home prices higher than a year earlier. Strongest growth in home prices was in Sydney (up 11.5 per cent) followed by Melbourne (up 11.2 per cent) and then there was a fair gap to the other capital cities. Next strongest were Brisbane and Canberra with prices in both cities up 4.1 per cent on a year ago. Home prices were lower than a year ago in Perth (down 3.7 per cent), Darwin (down 3.6 per cent), Hobart (down 0.7 per cent), and Adelaide (down 0.1 per cent).
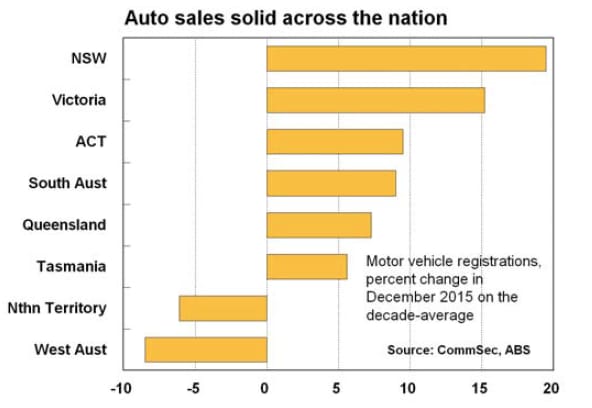
Currently we look at eight indicators to get the broadest assessment of economic performance. If we added new motor vehicle registrations to the list the only change in the overall economic rankings would be the ACT taking third position on its own.
NSW has a solid grip on the top ranking of economic performance. Unemployment has improved while population growth is above long-term averages, thus providing solid momentum to the economy.
Victoria also still has a strong grip on the second ranking but hasn’t been able to narrow the gap with NSW. Victoria still has the strongest population growth in the nation, underpinning retail and housing activity.
The ACT has been the big improver in the rankings and a sharp lift in dwelling starts is a clear reason for the improvement. Stronger housing activity will support the job market and retail spending over 2016.
The Northern Territory will face challenges in the next few years as key resource projects are either completed or near completion. Slow population growth, weak demand for housing loans and a sharp fall in dwelling starts will constrain economic momentum. Western Australia continues to slip in the performance rankings, having relinquished top spot in October 2014.
Slower population growth and higher unemployment will constrain activity in the housing market. Queensland remains in the third tier of economies alongside South Australia and Tasmania. Encouragingly, however, unemployment has fallen to two-year lows in trend terms.
And dwelling starts have lifted to 7½ year highs. The South Australian job market has improved in the past eight months. If the positive trend continues, then there is scope for an improvement in retail spending. The Tasmanian economy continues to struggle for momentum. In October, trend unemployment had fallen to near 4-year lows. While unemployment has lifted in the past two months, real wage growth remains healthy.
Craig James is chief economist, CommSec and Savanth Sebastian is economist, CommSec. Both can be contacted here.

