More regions benefit from firm housing activity: CommSec's Craig James

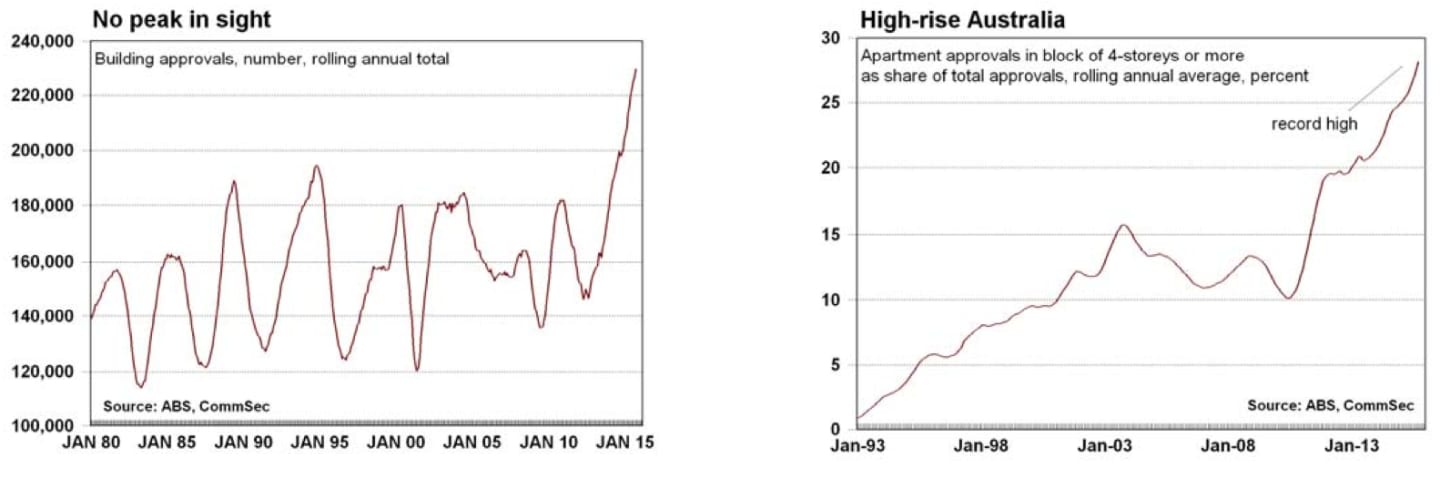
Building approvals were at record highs in the year to September. The current annual total of approvals is 18% higher than the previous peak set 21 years ago. In short, the economy will remain driven by the housing sector well into 2016.
What do the figures show?
Home prices
The CoreLogic RP Data Hedonic Australian Home Value index of capital city home prices rose by 0.2% in October to stand 10.1% higher than a year ago.
House prices rose by 0.1% in October while apartments rose by 0.4%. House prices were up 10.5% on a year ago and apartments were up by 7.7%.
The average Australian capital city house price (median price based on settled sales over quarter) was $621,000 and the average unit price was $515,000. The average Sydney house price was $940,000 – still some way off the $1 million mark.
Dwelling prices rose in five of the eight capital cities in October: Adelaide & Canberra (up 1.5%), Hobart (up 1.4%), Melbourne (up 0.6%) and Sydney (up 0.3%). Prices fell in Perth (down 2.8%), Brisbane (down 0.2%), and Darwin (down 0.1%).
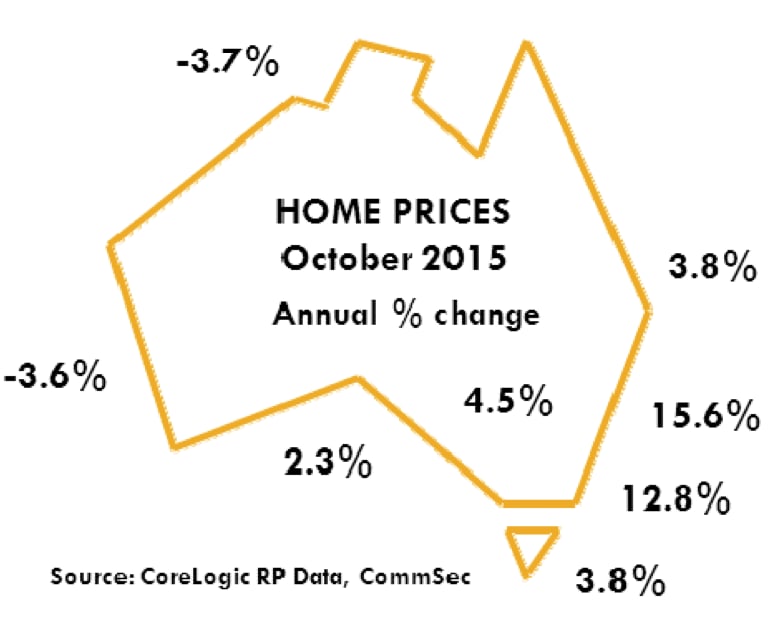
Home prices were higher than a year ago in six of the eight capital cities. Prices rose most in Sydney (up 15.6%), followed by Melbourne (up 12.8%), Canberra (up 4.5%), Brisbane and Hobart (both up 3.8%), and Adelaide (up 2.3%). Price fell in Darwin (down 3.7%) and Perth (down 3.6%).
Total returns on capital city dwellings in the year to October rose by 14.2% with houses up 14.5% on a year earlier and units up 12.5%.
CoreLogic RP Data noted: “Clearance rates have been trending lower since April this year, with Sydney and Melbourne now showing auction clearances that are below 70% week to week. Additionally, monthly mortgage related activity across CoreLogic RP Data’s valuation platforms was lower when compared with the same period a year ago; the first annual fall in platform activity since 2013. Added to this are record levels of new housing supply now entering the market. We are now seeing a picture of reduced house price inflation over the coming year.”
Performance of Manufacturing
The Performance of Manufacturing index fell from 52.1 to 50.2 in October. A reading above 50.0 indicates that the sector is expanding.
Production, orders, employment and sales fell in October but inventories, exports, selling prices, wages and capacity utilisation rose.
Building Approvals:
Dwelling approvals rose by 2.2% in September after falling 9.5% in August and rising 9.5% in July. Over the past year a record 229,438 new homes were approved.
House approvals fell by 2.0% in September (private sector fell by 1.9%). Meanwhile ‘lumpy’ apartment approvals rose by 6.9% in September after falling by 20.8% in August and rising by 22.7% in July. Private sector apartment approvals rose by 6.1% in September.
Dwelling approvals are up 21.4% on a year ago with house approvals up by 1.1% while apartments are up by 53.3%.
Across states and territories in September: NSW approvals fell by 16.6%; Victoria rose by 5.0%; Queensland rose by 41.6%; South Australia fell by 14.9%; Western Australia fell by 8.9%; Tasmania rose by 31.6%. In trend terms, approvals fell by 3.3% in the Northern Territory and fell 0.7% in the ACT.
The value of all commercial and residential building approvals fell by 2.1% in September after falling by 5.9% in August. Residential approvals fell by 4.3% with new building down by 5.4% while alterations & additions rose by 4.7%. Commercial building rose by 2.9% in September to be up 8.8% over the year.
Inflation gauge
The monthly inflation gauge was unchanged in October after a 0.3% rise in September. The annual rate of inflation eased from a 10-month high of 1.9% to 1.8%.
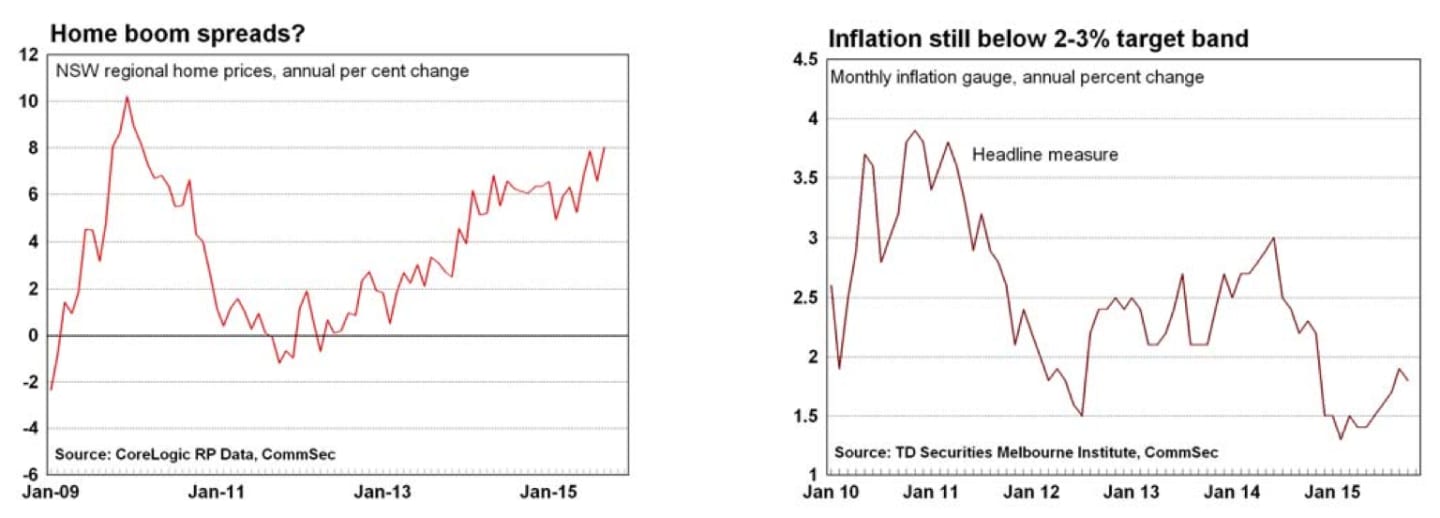
Tradable good prices fell by 0.3% in October after rising by 0.5 cent in September. Tradable good prices are up just 0.9% on the year. Non-tradable prices were up 0.2% to be up 2.4% over the year.
The underlying rate (trimmed mean) was flat in October after rising 0.2% in September. The annual rate rose from 1.6% to 1.7%.
Excluding volatile items like petrol and fruit & vegetables, the core inflation gauge rose by 0.1% in October to be up 2.2% over the year.
TD Securities noted that: “Contributing to the overall change in October were price rises for tobacco (+1.3%), newspaper, books and stationery (+3.0%), utilities (+1.3%). These were offset by price falls in fruit and vegetables (-1.1%), holiday travel and accommodation (-1.5%), and bread and cereal products (-1.1%). The price of automotive fuel eased slightly in October.
What is the importance of the economic data?
The CoreLogic RP Data Hedonic Australian Home Value Index is based on Australia’s biggest property database. Unlike the ABS Index, which excludes terraces, semi-detached homes and apartments, the CoreLogic- RP Data Hedonic Index includes all properties. Home prices are an important driver of wealth and spending.
The Australian Industry Group and PricewaterhouseCoopers compile the Performance of Manufacturing Index (PMI) each month. The Australian PMI is the Australian equivalent of the US ISM manufacturing gauge. The PMI is one of the timeliest economic indicators released in Australia. The PMI is useful not just in showing how the manufacturing sector is performing but in providing some sense about where it is heading. The key ‘forward looking’ components are orders and employment.
The TD Securities/Melbourne Institute Monthly Inflation Gauge is designed to “provide a timely and accurate monthly measure of inflation in Australia”. The Bureau of Statistics only releases the Consumer Price Index on a quarterly basis.
The Bureau of Statistics' monthly Building Approvals release contains figures on local council approvals to build residential structures such as homes and units as well as commercial premises such as offices and shops. Approval is one of the first stages of the construction ‘pipeline’ and is thus a key leading indicator of future activity. An increase in approvals would point to stronger future activity for construction-related companies.
What are the implications for interest rates and investors?
If major banks hadn’t been forced to lift interest rates to cover the cost of new capital, the Reserve Bank would have had an easy decision on interest rates. Interest rates would have been left on hold. While the decision is now more finely balanced, we believe that the Reserve Bank will wait a little longer to evaluate the impact of major bank increases in home loan rates.
The lift in apartment approvals in September will add yet more work to the housing pipeline. Approvals hit record highs in the 12 months to September with almost 30% of activity from apartment buildings of four storeys or more in height.