
Housing bloodbath predictions in oversupply: Pete Wargent

Pete WargentDecember 7, 2020
House prices rise a bit in Q1
Another day, another media article predicting a property bloodbath (again), with some 'proper weird' quoted figures on an apparent housing oversupply in New South Wales (?) and undersupply in Western Australia (?!).
Ho hum.
Ho hum.
Meanwhile back in the real world the ABS released its Residential Property Price Indexes for the 2015 quarter.
Let's take a quick look via six quick-fire graphics plundered from my chart packs.
Let's take a quick look via six quick-fire graphics plundered from my chart packs.
1 - Quarterly and annual price gains
Firstly, and most notably, it is clear that if we exclude Sydney, there was not really much of a property boom happening in Australia in the first quarter of the year, and indeed there hasn't really been for quite a number of years.
We might add the possible exception of Melbourne which has defied gravity for a fairly long time now, surprising quite a few commentators...including me, to be fair.
In the first quarter of the calendar year Melbourne (+0.6 per cent), Adelaide (+0.7 per cent), Brisbane (+0.5 per cent) and Hobart (+0.4 per cent) each recorded moderate price growth, while prices jumped a little in Canberra (+1.0 per cent).
Over the past year Melbourne (+4.7 per cent), Brisbane (+3.9 per cent) and Canberra (+3.0 per cent) have each recorded decent if unspectacular price growth according to the ABS indices.
Elsewhere, dwelling prices have been tracking at relatively flat or moderately declining levels in real terms.
As expected, only Sydney has shown genuinely strong price growth over the past year with prices once again surging 13.1 per cent higher.

Generally speaking house prices (+1.7 per cent) performed better than attached dwellings (+0.8 per cent) in the first quarter of the year.
In fact, although unit and townhouse prices surged again in Sydney (+2.2 per cent) and rose a little in Brisbane (+0.7 per cent), they declined in Melbourne (-0.8 per cent) and were down in no fewer than four of the other capital cities.
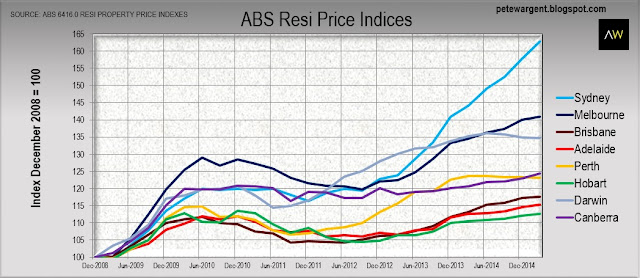
2 - Long run indices
Since 2008 when a number of media pundits began calling for - nay, guaranteeing - outlandishly dire outcomes for Australia's housing markets, as predicted on this blog Sydney, being the most undersupplied major city market, has actually seen its dwelling prices increase.
In fact, Sydney prices are now up by an incredibly strong 63 per cent since Q4 2008, a farcical margin of error for those who were forecasting a crash.
In fact, Sydney prices are now up by an incredibly strong 63 per cent since Q4 2008, a farcical margin of error for those who were forecasting a crash.
Awkwardly, even Melbourne's prices have shot up by 41 per cent over the past six-and-a-bit years, although price growth does seem to have moderated somewhat of late, on these indices at least.
The softest performing capital cities since 2008 have been those located in the southern states, being Adelaide (+15 per cent) and Hobart (+13 per cent), with Perth (+23 per cent) and Brisbane (+18 per cent) sitting somewhere in the pack.
The ABS series only runs back to September 2003 and thus omits to record Sydney's preceding boom, thereby showing the harbour city as the worst performing capital over the past dozen years.

I'm not really old enough to recall what happened to Aussie house prices in the 1980s.
Fortunately for anyone who was wondering, Dr. Chris Caton, - Chief Economist of BT Financial - reliably informs me that since 1987 the strongest performing capital city markets have been Sydney, Brisbane, Perth and Melbourne, in that order.
And believe me Dr. Chris definitely is old enough to remember the 1980s.
And believe me Dr. Chris definitely is old enough to remember the 1980s.
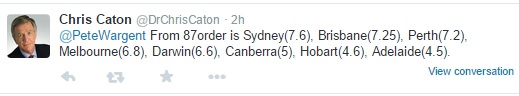
Thank you kindly, Dr. Chris.
3 - Total value of dwelling stock
Since September 2011 the total value of New South Wales dwelling stock has powered 37 per cent higher to $2.1 trillion.
This in turn has helped to drive the total value of Australia's dwelling stock up to $5.5 trillion as at March 2015, a figure which for some reason people like to compare to Australia's Gross Domestic Product (it's 3x), though I haven't yet been able to fathom the relevance of the comparison - except to note that a material correction could of course have a notable impact on the wider economy.
This in turn has helped to drive the total value of Australia's dwelling stock up to $5.5 trillion as at March 2015, a figure which for some reason people like to compare to Australia's Gross Domestic Product (it's 3x), though I haven't yet been able to fathom the relevance of the comparison - except to note that a material correction could of course have a notable impact on the wider economy.
Perhaps surprisingly, Western Australia is next in line with the value of dwelling stock growing by 21 per cent to $600 billion over the same time period, in part driven by exceptionally strong population growth in the state.
Victoria (+19 per cent to $1.4 trillion) and Queensland (+14 per cent to $0.9 trillion) have also seen the total value of their respective dwelling stocks increasing in recent years
The four most populous states have thus accounted for the overwhelming bulk of dwelling value growth in dollar terms over that time since Q3 2011, at a thumping 94.3 per cent of the total.

4 -Mean dwelling prices
Penultimately for today, the mean dwelling price has bolted 13 per cent higher over the past in New South Wales to $712,000.
Victoria (+4 per cent to $569,100), Queensland (+3 per cent to $462,300) and South Australia (+3 per cent to $416,700) each recorded moderate growth in mean prices.
Victoria (+4 per cent to $569,100), Queensland (+3 per cent to $462,300) and South Australia (+3 per cent to $416,700) each recorded moderate growth in mean prices.

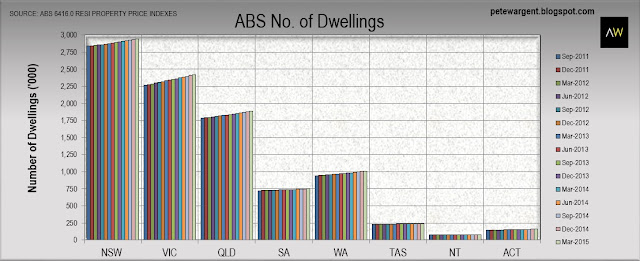
5 - Number of dwellings
Finally, one of the most perplexing pieces of "analysis" to emerge this week concerned an apparent oversupply of dwellings in New South Wales.
Goodness knows where those figures were plucked from, not that state level figures tell us anything much useful in any case.
For the record, New South Wales added a grand total of 7,400 dwellings on a net basis in the March quarter (woo!), while the latest population growth statistics show that the state's population growth is bursting at the seams at around 106,400 additional heads per annum (around 85,000 of those in Greater Sydney).
Over the three years to March 2015 the total number of dwellings in the state of New South Wales has increased by only a net 95,800 to a total of 2,946,100.
The exact population growth figures for the same period are not yet known, but the figure is likely to end up punching at well over 300,000, with the latest state total population figures implying that the total is now somewhere north of 7.5 million.
The exact population growth figures for the same period are not yet known, but the figure is likely to end up punching at well over 300,000, with the latest state total population figures implying that the total is now somewhere north of 7.5 million.
I'm not sure how one concocts an "oversupply" out of those numbers, particularly given that we were already coming off the back of half a decade of under-building in Sydney.
Rents have continued to rise in Sydney over the years too, which itself is telling.
Rents have continued to rise in Sydney over the years too, which itself is telling.
Overall the total number of dwellings increased by 38,200 in Australia in the first quarter to a grand total of 9,491,700.
This surprisingly implies a slight slowdown in completions in the first quarter given that the net year-on-year increase in dwellings was 162,600.
This surprisingly implies a slight slowdown in completions in the first quarter given that the net year-on-year increase in dwellings was 162,600.
Pete Wargent
Pete Wargent is the co-founder of BuyersBuyers.com.au, offering affordable homebuying assistance to all Australians, and a best-selling author and blogger.