
Sydney investor activity turning parabolic - how long will the boom times run?

The ABS released its Lending Finance data for the month of December, and the figures were a neat microcosm of the challenges facing the Reserve Bank of Australia.
Commercial finance - a data series of which property investor loans are a subset - fell by another 2.9% in December and the trend has now moved beyond its November peak, with the trend in total lending looking increasingly weak.
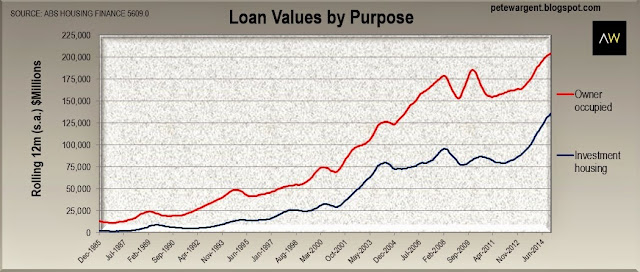
Yet as we saw earlier in the week, we know that owner-occupier housing lending had begun to pick up again, even prior to the February rate cut.

And it was the dramatic pre-rate cut 6% surge in investor lending which really caught the eye, with investor lending surging by a massive 24.6% higher on a rolling annual basis over the past 12 months.
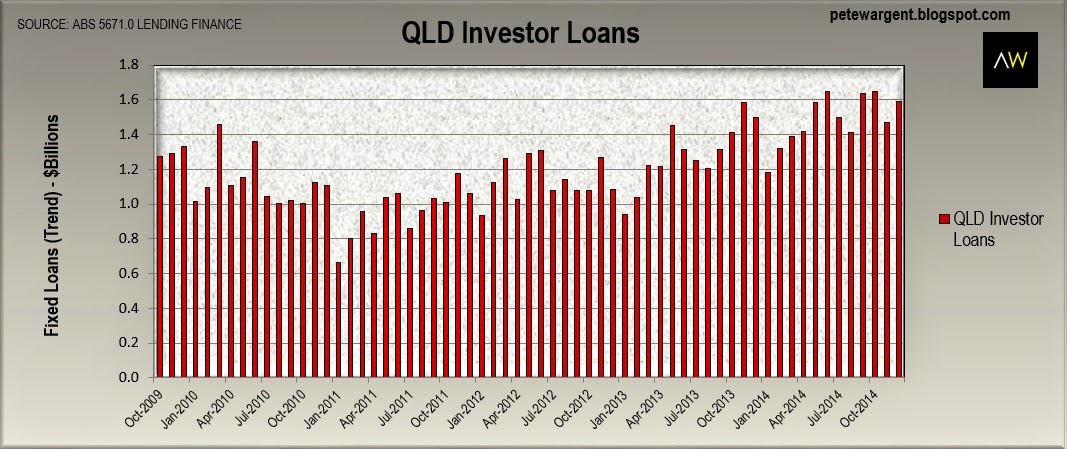
The detailed investment lending figures are hidden within the data above. Let's take a look to see where property investors are buying.
Sydney goes parabolic
The Lending Finance data tells us where the investment loans are being written - in a word, Sydney.
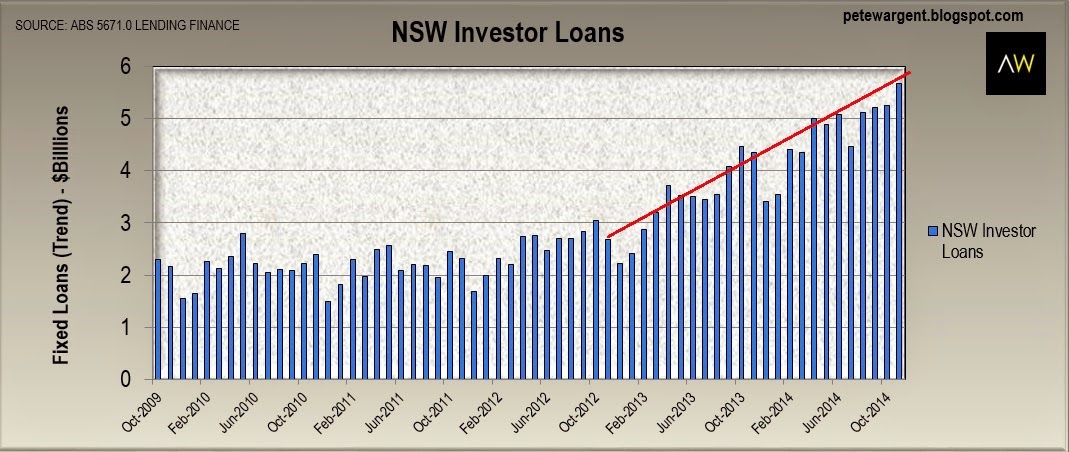
And how! An extraordinary $5.7 billion of New South Wales lending in December was yet another all-time record month of lending, easily eclipsing the record $5.26 billion state record set in November (which itself beat records set in September and October respectively).
This comes off the back of New South Wales owner-occupier commitments which ripped through a state record $6 billion in the same month.
The accelerating rate of investor growth is the really astonishing point of note - another 8% surge even before interest rates were cut again suggests that the annualised lending volumes for New South Wales could now be anything...perhaps heading towards $65 billion or even $70 billion plus.
This is both extraordinary and unprecedented.
Throw in the increasing weight of foreign capital as the Australian dollar depreciates and the inner Sydney housing market could be in for a blockbuster 15 months.
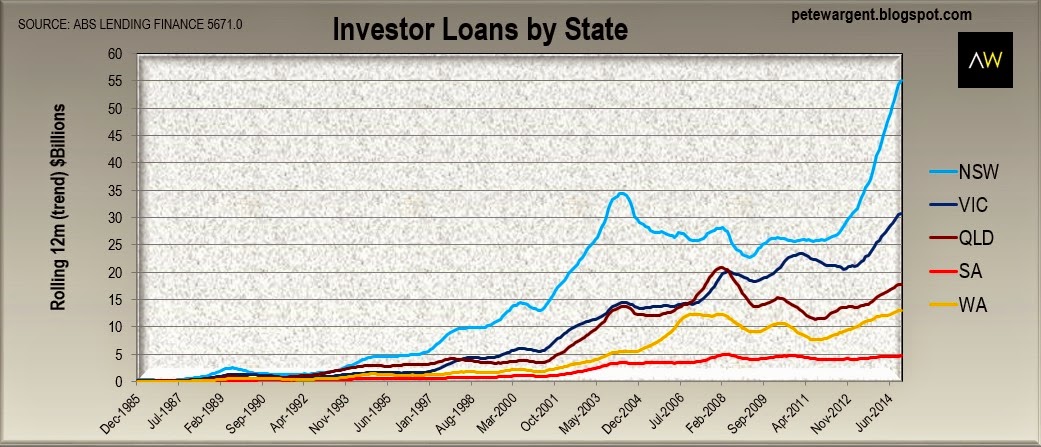
While this has already led to a predictable bout of "property bubble" hysteria, it is worth noting here that there has been no such surge in investor lending in South Australia (Louis Christopher of SQM Research described the Adelaide market as "dead as a door nail" - a touch harsh perhaps, but there's certainly no boom apparent), the Northern Territory, Tasmania or the Australian Capital Territory where prices are falling.
Meanwhile the burst of activity in Western Australia is now clearly tapering off.
The housing finance and lending finance data series do suggest that the Melbourne market appears to be having something of a second wind - but high volumes of construction and a material stock overhang should help act to keep a lid on dwelling price growth in the Victorian capital henceforth.
Sydney to boom - all bets are off, but for how long?
What is unfolding in Sydney is now a law unto itself - albeit not surprising to long-term readers of this blog - due to inner Sydney's inherent undersupply of dwellings which has allowed rents to rise in concert with prices, a dynamic which simply wouldn't have existed without an undersupply.
Preliminary auction clearance rates on Saturday of a massive 83.3% reported suggest that a red hot Sydney market has kicked off once again in 2015.
The monthly level of investor lending in this seasonal series is now incredibly more than 2.5 times the volumes we were seeing only 3 years ago, and still rising fast.
It is imperative that those buying in the harbour city have a clear understanding of which suburbs have already blown off (cf. the inner west in particular) and which have yet to kick forward so materially in this cycle.
Buyers should also consider forthcoming transport and infrastructure links which will be key market drivers over the next five years.
Market defies gloomers
Not only have prices not crashed, activity in the market appears to be accelerating - how did Sydney's housing bears get it so unfathomably wrong?
On balance, the main reason is likely that they neglected to note the chronic undersupply of dwellings in inner Sydney caused by the best part of a decade of under-building, which only now is being addressed by record high unit approvals.
Even in 2014 median apartment rents continued to increase by another 3.85 to 4.3% depending on your data source.
The median unit price in Sydney at the end of Q4 2014 was around $606,500, with median apartment rents of around $540/week implying gross yields of approximately 4.6%.
Vacancy rates in inner Sydney are still only around 1.5% (despite the onset of an apartment construction boom with all-time record home starts) which is a veritable world away from the elevated vacancy rates which helped to pull up stumps on the preceding boom in 2004.
Article continues on the next page. Please click below.
How much longer will this boom run?
One thing that we can now say with 100% certainty is that high interest rates will not be responsible for calling time on this property boom.
Just as in 2003/4 this market boom may simply have to die of "old age" when gross yields fall to unacceptably low levels, perhaps with vacancy rates rising significantly helping to drag down rents.
How low investors will be prepared to bid gross yields is unknown for we are now into uncharted territory, both in terms of the volume of loan approvals and in terms of mortgage rates.
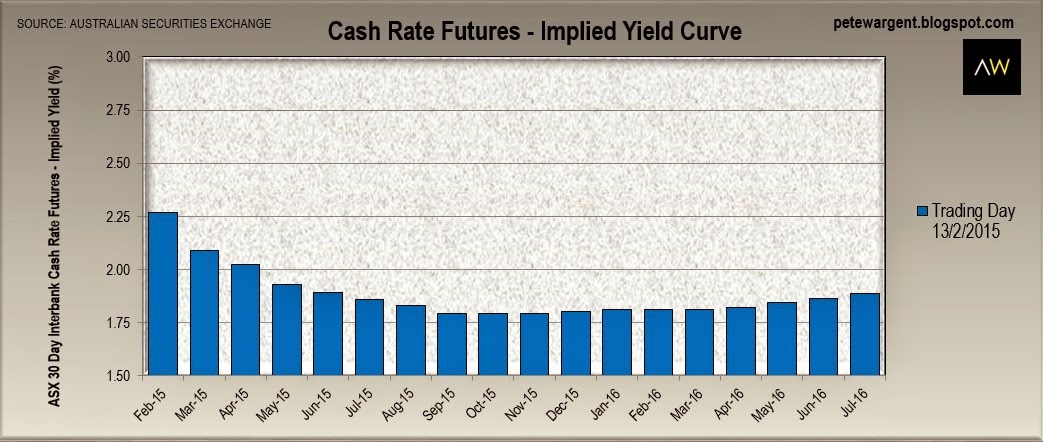
By way of comparison the cash rate in December 2003 was hiked by 25bps to 5.25% - today the cash rate is just 2.25% with a 71% chance of it being cut by 25bps to only 2% as soon as 3 March.
Futures markets see a 2% cash rate this calendar year as getting close to a stone dead certainty.
Consider a stylised example within which median apartment rents were to increase by another ~4% over the next five quarters to $560 per week.
If this seemingly endless supply of investors was prepared to bid gross yields 0.5% lower - broadly reflecting expected shifts in the cost of borrowing - all the way down to 4.1%, then this simple model implies that the median apartment price would soar by another 17% or more than $100,000 to above $700,000 - which is a frankly terrifying prospect for first homebuyers.
Could this happen?
With five year fixed rate mortgages available from under 4.7%, three year fixed rates from under 4.3% and 1 year fixed rates even advertised with a 3 handle, it is far from inconceivable, particularly with February's rate cut already adding further fuel to the fire.
whether or not this plays out will now be decided by how quickly apartment completions come online and whether APRA intervenes directly in the mortgage lending market.
Queensland
Investor activity is also robust in Queensland, although commentators will in all likelihood be wrong-footed by this year's data for the Sunshine State.
While property viewings in the inner suburbs of Brisbane are increasingly crawling with interested buyers, this will be offset by a number of regions within which property markets are in a significant decline, particularly certain mining towns and regions impacted by the collapse in coal prices.
On the ground we are clearly seeing more and more evidence of interstate investor activity and buyers agents at work in inner Brisbane suburbs (as well as hearing of the same from agents with raised eyebrows).
Queensland - affordable markets
While on the face of it the level of housing affordability is what causes our housing markets to ebb and flow, it's as likely to be demographic shifts, labour force trends, dwelling supply, the cost of borrowing and the availability of credit in Australia which drives property market movements.
The unemployment rate has been at a historically low level but has been rising steadily through 2013 and 2014.
The issue of affordability is an ongoing one, and being an emotive issue, the dynamics of how housing markets actually work in practice are often not considered.
The great paradox of today's rising asset prices is that the prevailing low interest rate environment has improved affordability considerably for existing homeowners but made bridging the deposit gap correspondingly more challenging for first-time buyers as market entry prices rise.
Older hom eowners often come to me expressing wide-eyed surprise at the level of their surplus income, the driver of which has clearly been the structural shift to low inflation and lower interest rates over the past 25 years.
Article continues on the next page. Please click below.
Multiples of income
The way in which housing markets from different countries are compared to each other is most often by taking the median price of a house and dividing it by an average measure of household income to produce a multiple.
Looking at how long it would take to pay off an average house with an average income is a handy shortcut measure of housing affordability and a very easy means of comparison.
However this is not how capital city housing markets work in reality, since it flatly ignores the role of the cost of debt and the differing financial situations and stages of life that buyers and owners of property are in.
This widely favoured methodology fails to consider mortgage repayments - a housing market where prices are a lower multiple of incomes yet has mortgage rates of above 15% may still not necessarily be an affordable market.
In other words, the multiple of incomes method works on the flawed assumption that everyone is a first home buyer with a 80-100% loan.
There are essentially four different types of buyer, and issues of affordability affect each of them differently.
1 - No finance
The percentages fluctuate each year, by city, by state and by region, but between a quarter and a third of properties tend to be bought with no financing.
How so? Well, there are some lucky folk whose parents buy their homes for them, but most often this happens due to the sale of an existing home. Empty-nesters and downsizers form part of this phenomenon.
Other older buyers who are mortgage free opt to move to a similarly-sized home and thus require no debt financing.
The Reserve Bank's financial aggregates show that Australia has approaching $1.5 trillion of outstanding housing credit, with the split allocated as 34.3% investors and 65.7% owner-occupiers.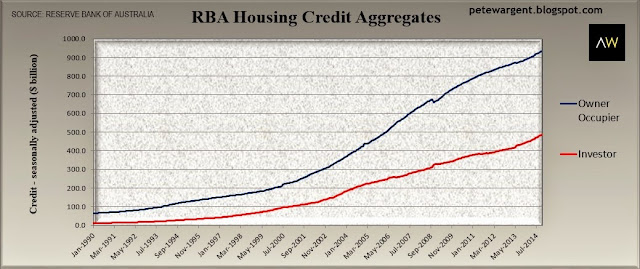
Yet even the sum total of all forms of household debt is comfortably dwarfed by the huge value of Australia's 9,448,300 dwellings as estimated by the Australian Bureau of Statistics at a massive $5.4 trillion.
Cash buyers are affected little by rising or falling interest rates, and often they remain unaffected by the base value of housing, since the asset which they are selling may rise in tandem with the asset they opt to buy.
2 - Investors
As our capital city housing markets mature and the population expands largely through immigration, it is expected that the number of properties owned by investors will also increase.
Australian Finance Group (AFG) consistently recorded that around 40% of loans written in Queensland in 2014 were for investors. In cities such as Sydney around half of loans presently written are investment loans.
Australia-wide one of the gauges or indicators over time of how much property is bought by investors is the rate of home ownership, which seems likely to slide in the decades ahead.
With some investors choosing to own multiple properties, investors tend to comprise a significant%age of capital city property purchases.
Affordability is not really an issue for most investors in the prevailing low interest rate environment, since rental income pays the bulk (if not all) of the mortgage, while there are tax deductions available for on-paper losses.
In Brisbane gross yields on apartments can be as high as 5.5%, although in some suburbs vacancy rates are clearly significant and unit rents may well ease in time as supply comes online.
Investors generally elect to buy property at times when rental yields are acceptable as compared to other available investments and in regions where they expect to see capital growth.
Most property investors are looking for locations where the population is expected to grow over time and therefore they have been very heavily focused on capital cities such as the inner suburbs of Sydney, Melbourne, and next up, Brisbane.
3 - Existing mortgagors
Again, the percentages fluctuate each year and by state, but around a third of the market of property buyers tend to be existing mortgagors who have equity in their home.
So the issue for these buyers of affordability is largely governed by interest rates and the price gap between the property they own and the one which they want to own.
Note therefore, that housing affordability for these buyers is correspondingly unrelated to the base value of their existing property, and is instead much driven by their own aspirations.
4 - First home buyers
The remaining 14% or so of property buyers are first home buyers according to the ABS (AFG has still not amended its reporting mechanisms which are recording first home buyers in Queensland at a nonsensical 3.7% of loans written), which is the one sector of the market for whom repayments versus household income is a genuinely important measure.
For this sector of the market the challenges to be overcome include the deposit gap and whether mortgage repayments can be well covered in the event of future interest rate hikes.
The first home buyer demographic which has access to a deposit and mortgage finance is driven by another equation: the cost of renting versus the expected mortgage repayments - which have plummeted - if a home is purchased.
The Wrap
The statistics show that housing affordability in Brisbane is relatively good for the majority of buyers since mortgage rates are now at previously unthinkably cheap levels.
In inflation-adjusted terms Brisbane prices are 13% below their March 2008 peak, so it would be no surprise in the current low interest rate environment to see median dwelling prices rise by 15 to 20% over the next three years.
That said, there are a great many new apartment developments coming online in the suburbs discussed on my blog previously, so price growth in generic unit stock is likely to be weaker.
How long Sydney's boom will run for is anybody's guess, but it seems that only regulatory intervention will deter investors now.
PETE WARGENT is the co-founder of AllenWargent property buyers (London, Sydney) and a best-selling author and blogger.
His book 'Four Green Houses and a Red Hotel' is out now.