
NAB Online Retail Sales Index continues to grow

The National Australia Bank (ABS) has released its Online Retail Sales Index December 2019.
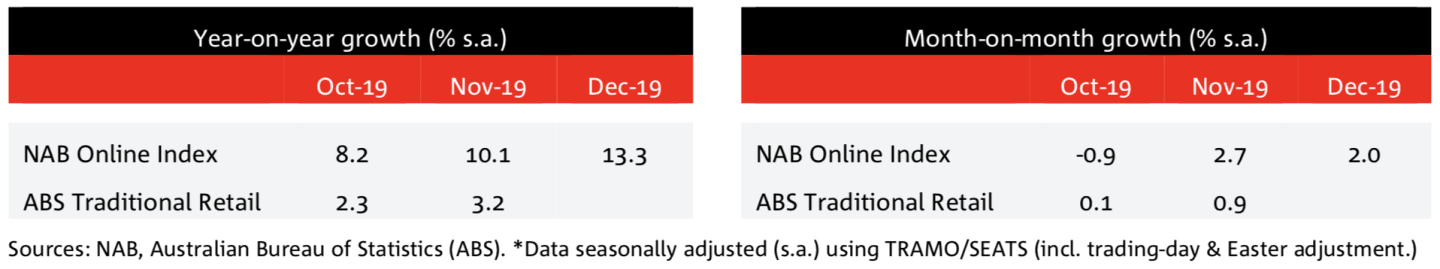
The report shows a continued month-on-month growth in December (+0.2 per cent), and a continued year-on-year growth (+13.3 per cent y/y s.a.).
The latter continuing to outpace broader ABS retail sales series.
Click here to enlarge.
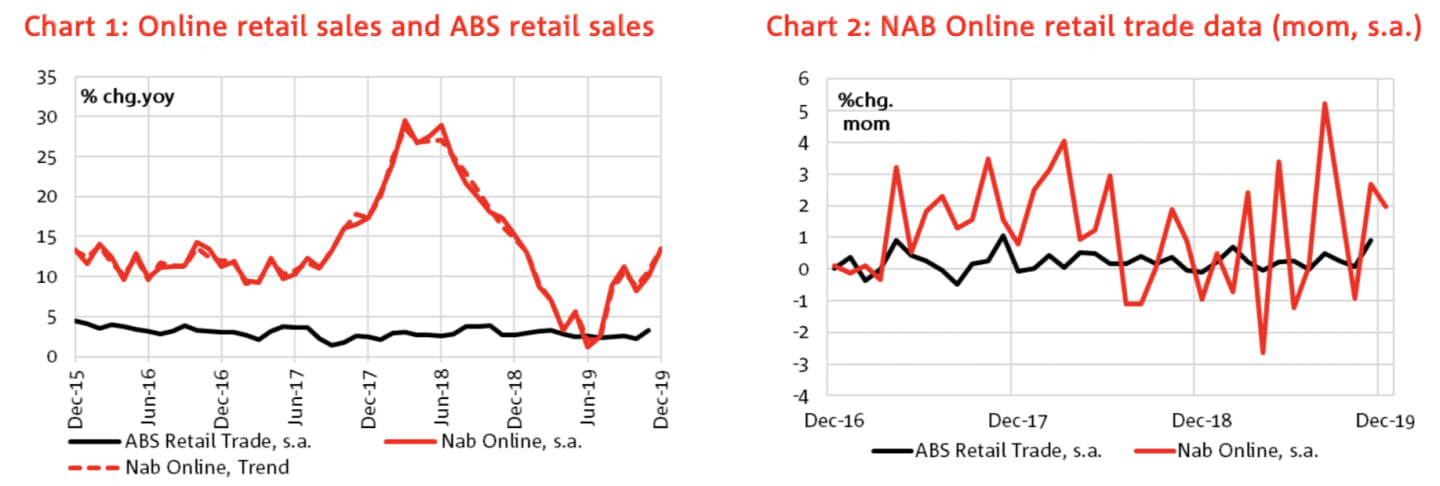
NAB chief economist, Alan Oster said the index data indicated that, while slowing slightly, growth continued in December.
"In contrast, our broader estimate of retail trade indicates significantly weaker overall sales.
"Looking through the month-to-month volatility, sales growth seems to have accelerated in year-on-year terms."
Click here to enlarge.
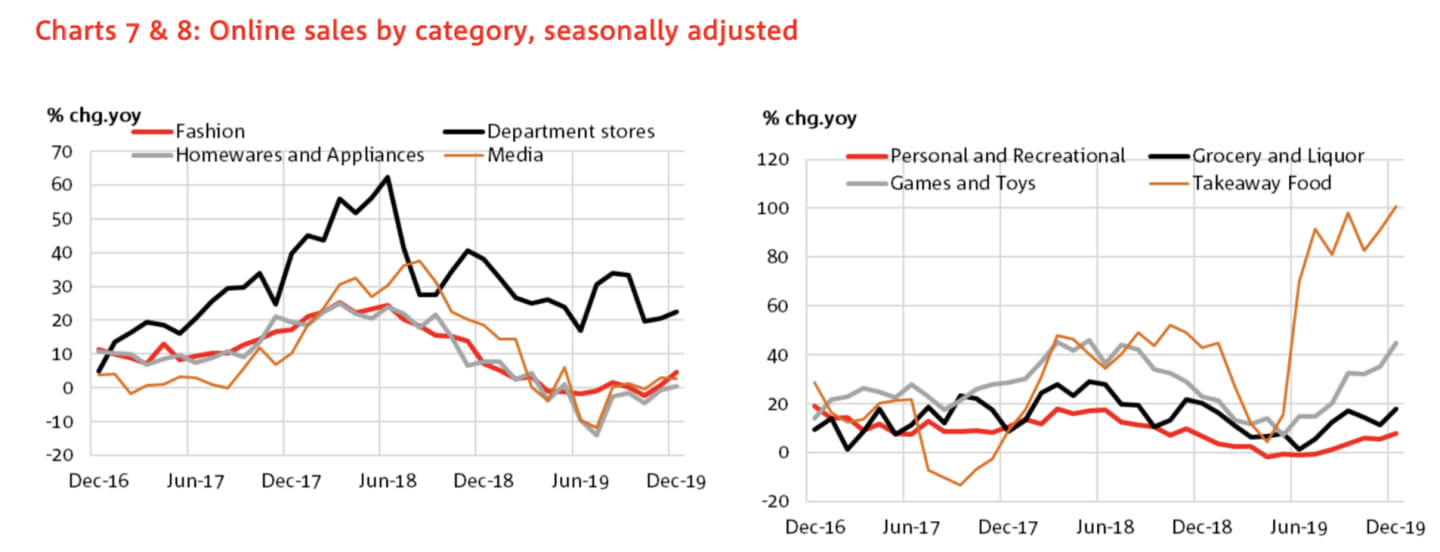
All categories, except fashion, recorded sales growth in month-on-month growth terms. The largest sales category, homewares and appliance (1.5 per cent mon, s.a.), continued to grow at a rate lower than the overall.
Mr Oster notes, "The smallest sales category, takeaway food, continues to lead growth, followed by second smallest category, games and toys, with rapid growth also for larger sales category, department stores."
Click here to enlarge.
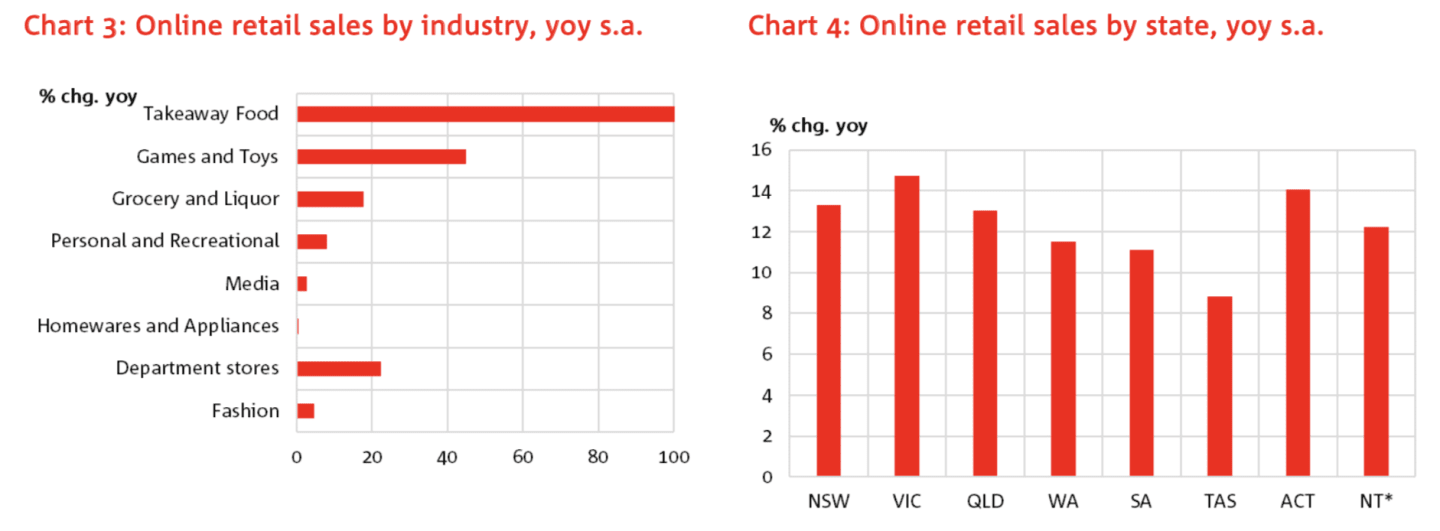
Grocery and liquor sales accelerated in the month (+1.2 per cent mon, s.a.), and is approximately 17.8 per cent larger compared to the same period in 2018.
Click here to enlarge.
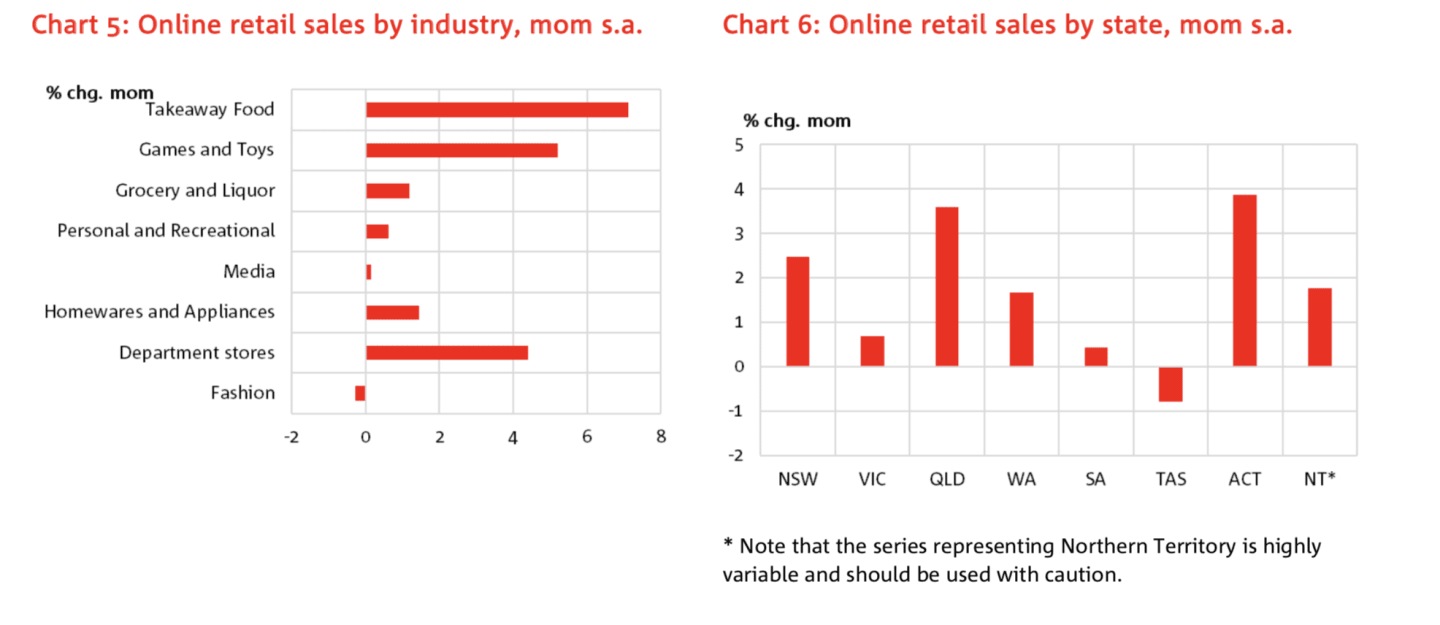
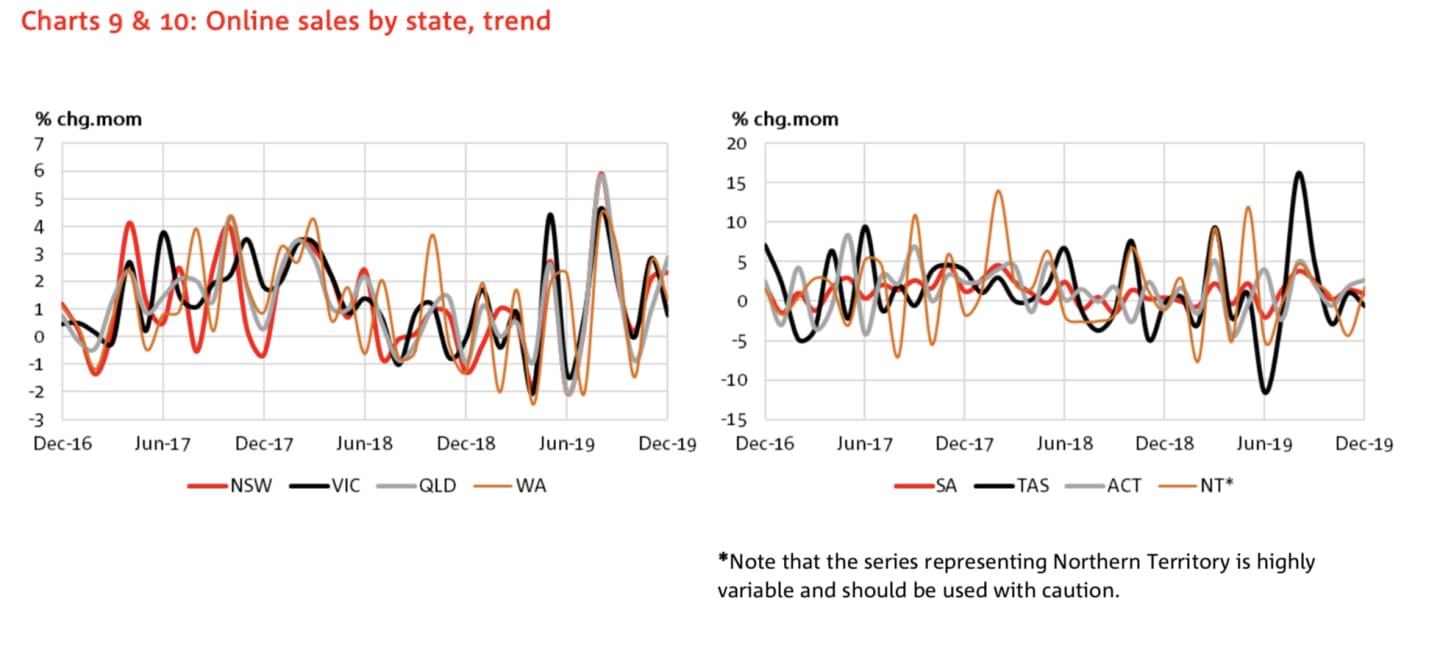
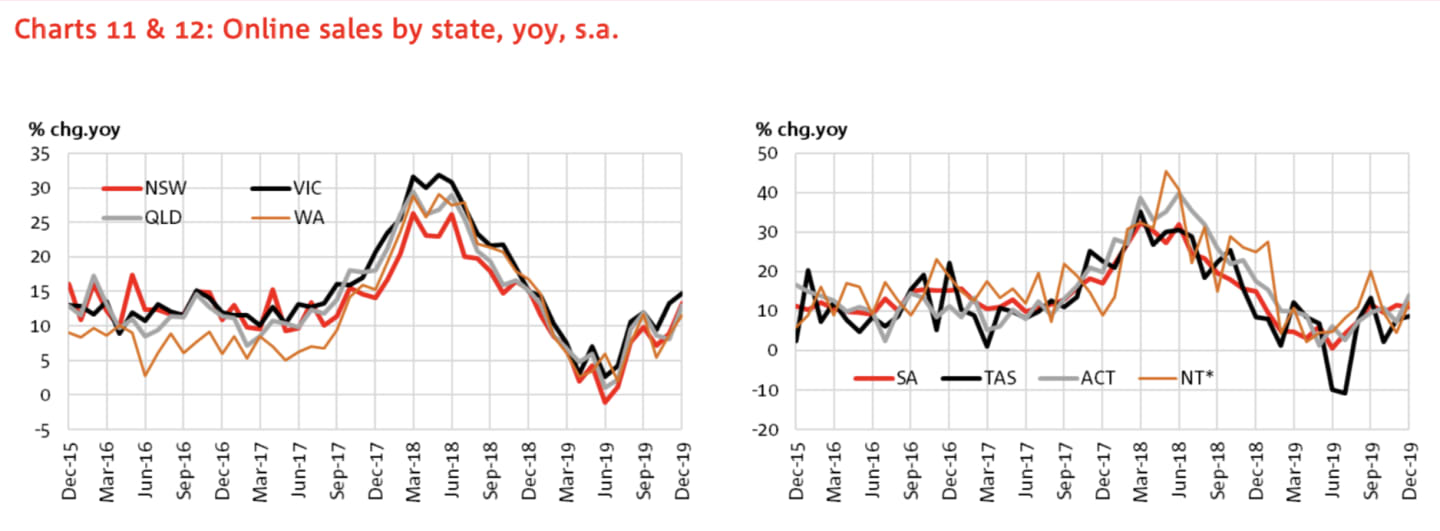
All states and territories except Tasmania recorded sales growth in the month of December."The three most populous states represent just over 80 per cent of all online sales, slightly above their share of the population", Mr Oster continues.
"A rebound in monthly sales growth puts Queensland in the lead for the large sales states, with ACT leading the smaller sales areas. Victoria continues to lead in year-on-year terms.
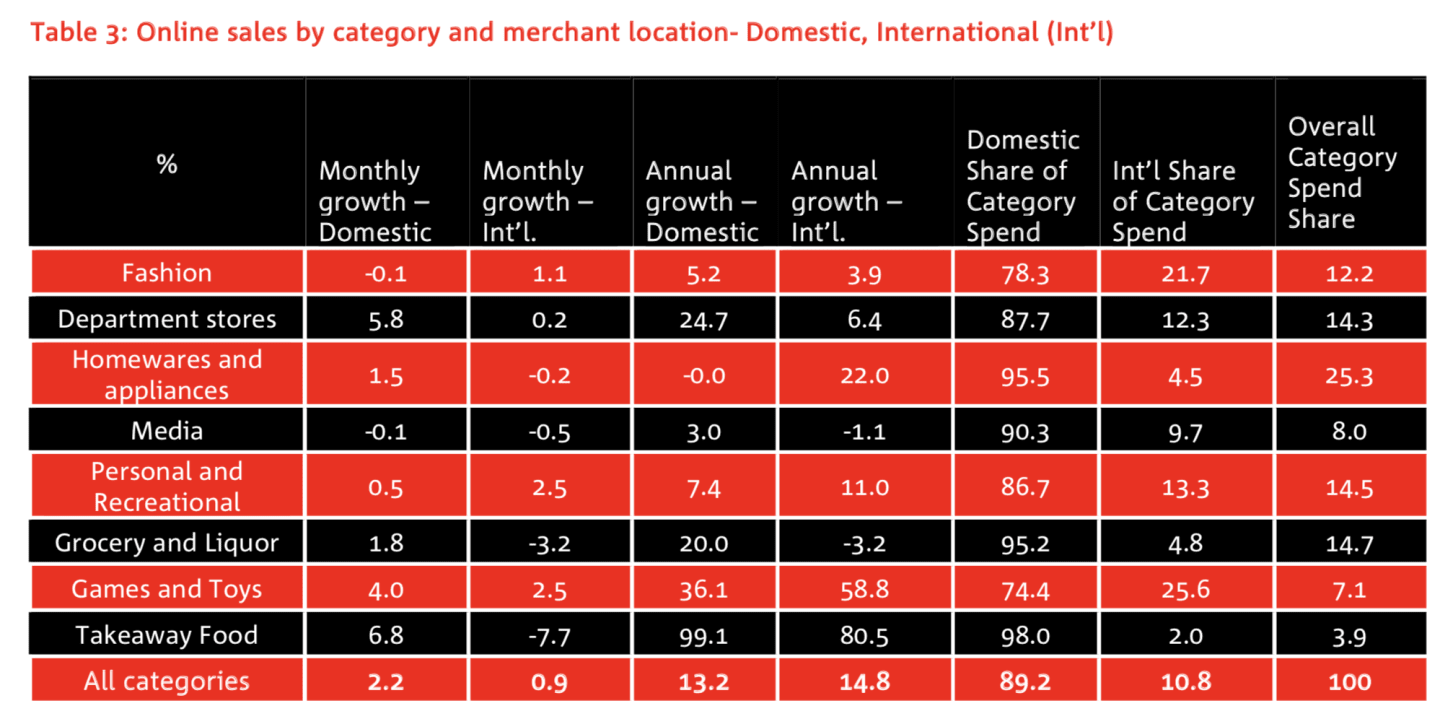
"Representing about two-thirds of all online sales, metropolitan areas recorded growth in line with the overall result, while regional area growth was much slower.
"In year-on-year terms, Queensland led metro growth, while Victoria leads regional areas on the same basis."
Click here to enlarge.
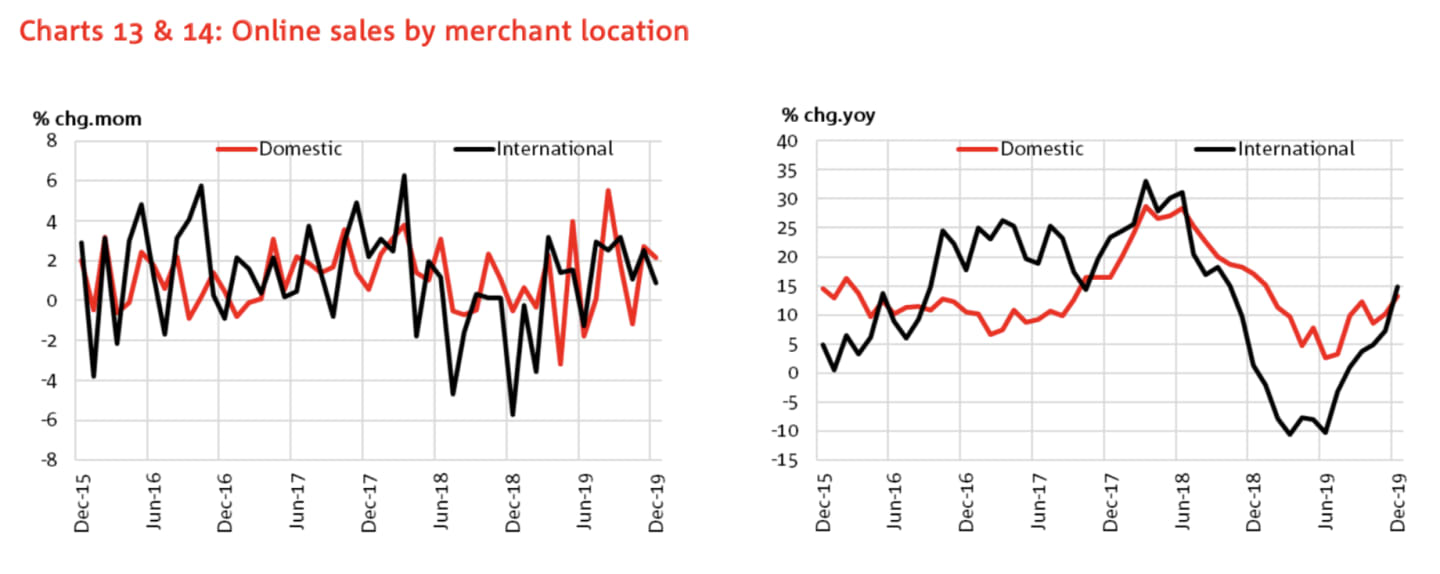
"By merchant location," Mr Oster explains, "international retailers grew at a much slower rate than the overall index, with domestic retailers slightly fast. While fashion growth broadly contracted, this key source of sales for international retailers continued to grow.
"International retailers also outpaced domestic retailers in the personal and recreational category. Growth for the largest sales category, homewares and appliances, was dominated by domestic retails, with international slightly contracting. While a small share of spend, international retailers also seem to be in retreat in the grocery and liquor category."
Click here to enlarge.
NAB estimates that Australians spent $30.53 billion on online retail in the 12 months to December. This is a level that is around 9.3 per cent of the total retail trade estimates (November 2019, Series 8501, Australian Bureau of Statistics), and about 9.7 per cent hight than the 12 months to December in 2018.
Click here to enlarge.
Mr Oster emphasises, "our definition of a domestic online retailer can include those merchants whose parent organisation might be overseas with an Australian subsidiary. Solely using GST as a key defining characteristic of domestic and international is no longer appropriate given changes made in July 2018".
Click here to enlarge.
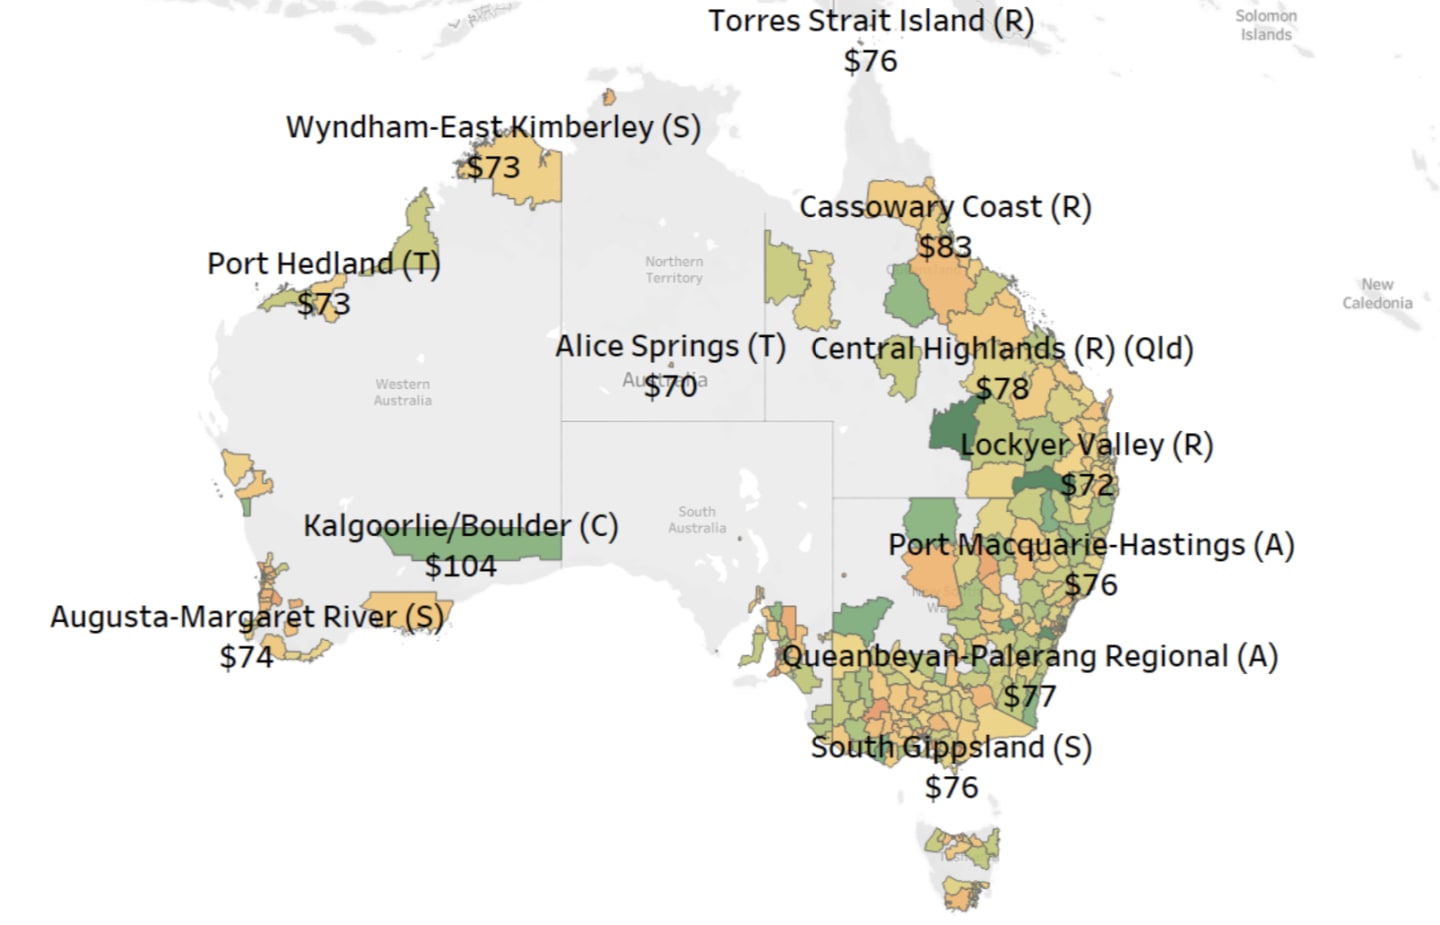
A heat map view of average online spend by local government area
Online spending varies depending on where people live. The map shows average spend for each online transaction. Not all the top average spend areas are in capital cities, nor are they all in remote areas.
Click here to enlarge.
The impact of the combined Black Friday and Cyber Monday sales event
The growth in December was boosted by the weekend continuation of the Black Friday sales event into the Cyber Monday period.
In NAB's November report, the effect of the first day of the Black Friday to Cyber Monday sales event were studied. As the sales event crossed between the end of November and the start of December, additional data is now included. This data may help explain the December divergence in growth rates for online relative to broader cashless.
For this analysis, NAB looked at the four key days of the sales event and compared it to the same sales event day in previous years.
Click here to enlarge.
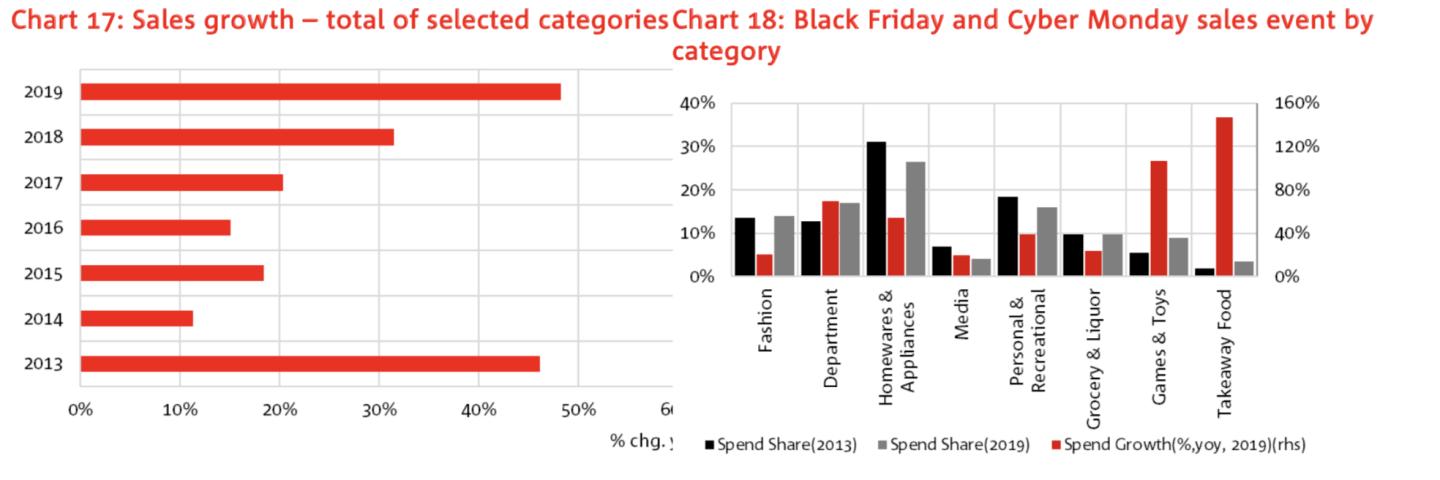
From a shaky start earlier in the decade, this sales event day appears to be growing. Chart 17 shows sales on Black Friday through to Cyber Monday for online retail categories increased about 48 per cent on the corresponding four day sales event in 2018. As a four day block, this sales event has been gaining momentum since 2016.
Chart 18 shows that by category, compared to the event period 2018, by far the largest growth was recorded for sales in takeaway food at 146 per cent growth. However, while the spend share for this category has grown from 2013, in NAB data, it still represents only about four per cent of sales in the four day period.
Given their share of sales, they key category drivers of the overall growth figure were homewares and appliances, department stores and personal and recreational goods.
Growth in the fashion category, which represents a significant share of sales is in the event period (14 per cent), was more subdued (20 per cent you, n s.a.).
It appears that these sales events are shifting the period of when sales occur, without adding to total sales. NAB data shows that the first two days of the event, Black Friday and Saturday, represented around 17 per cent of total November online sales. Sunday and Cyber Monday, which followed in December, represented over 15 per cent of December sales. In the comparable period of 2013, these values were 10 and 11 percent respectively.
Click here to enlarge.
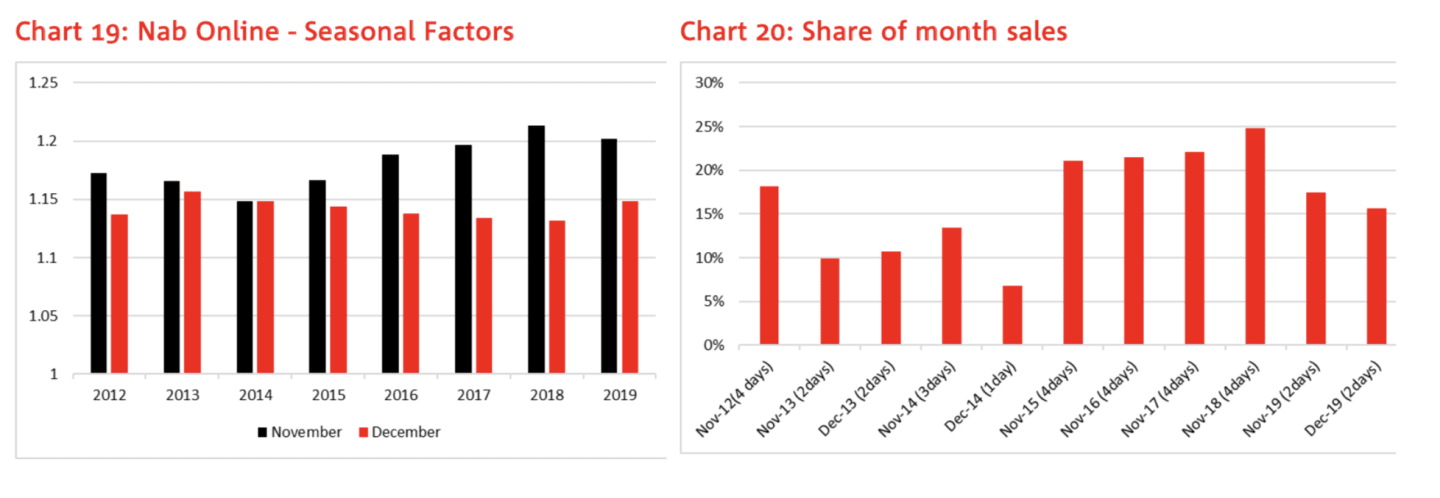
All these factors contribute to the changing patterns of spending within months, and across months.
This is problematic for the seasonal adjustment process, contributing to swings in the monthly retail sales data.
For online retail sales, while November remains the largest sales month, chart 19 shows that the large sales for the first two days of December have slightly increased the seasonal importance for that month.